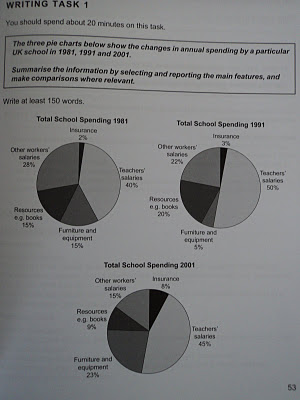
The pie charts shows the total expenditure of a school in UK during three particular years in 1981, 1991 and 2001
Overall, the highly expenditure is for paying teacher, while in the overall year school takes least portion to pay insurance.
As per the information, in 1981 school spent 40% of their expenditure to pay teacher salaries and the percentage increase about 5% in the next ten years. By comparison with the expenditure for insurance, being accounted 2 % in 1981, such trend had almost twenty fold increase in full loan of money spending. The expenditure for furniture and equipment is decrease in percentage prior to took a higher percentage. Accounting 15% of the expenditure in 1981, it experienced a sudden drop to 5 % before recover to 23% in 2001. Standing in contrast with the case of resource book which take the least 15 % in the 2001 and do highest percentage in 1991.
Other worker salaries experienced a gradual drop from 28% of the overall expenditure to reach 15% of the school expenditure in the end of statistic's year. The number of 15% is similar with the expenditure for buying furniture and equipment in 1981.

three_pie_charts.JPG
