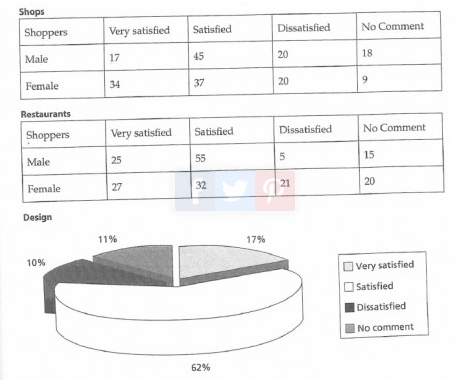
The table and pie chart illustrate the proportion of new shopping's responses of society in the capital city of Auckland based on result of research. Overall, it can be see that females experience very satisfied in shops and restaurant rather than males. in another case, both of them is predominantly feel satisfied in design sector.
The percentage of males who feel very satisfied in shops at around 17 %. Compare with females that depict twice of males proportion. While mainly of men satisfied and abstained than female in this side, both indicate an equal dissatisfied percentage at 20 %.In restaurants field, although they have similar number on very satisfied and no comment, men reveal a huge number of satisfied than female at 55% and 35 respectively. Moreover, women refer fourfold dissatisfied of the percentage of men.
turning to design, both of sexes think satisfied is 62 % and 17 % very satisfied of total proportion. These figures feel 11 % on dissatisfied; likewise, no comment reaction 10 %

257617_1_o.png
