Online retail sales
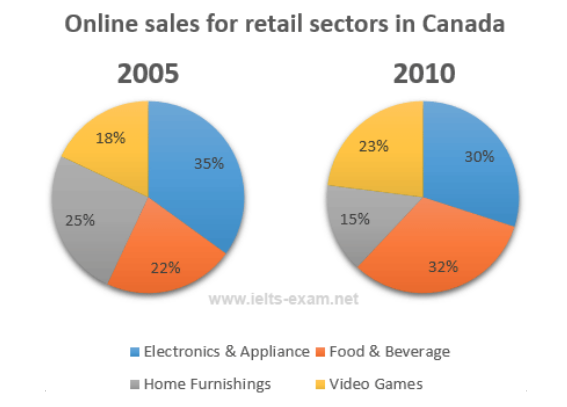
The two pie charts below show the online shopping sales for retail sectors in Canada in 2005 and 2010.
Summarize the information by selecting and reporting the main features, and make comparisons where relevant.
The two pie charts give information about the shopping sales on the Internet by reatiling in four different sectors in Canada between the year 2005 and the year 2010.
Overall, it is clear that the sales of electronic and appliance and the home furnitures increased slightly while two other sectors dropped suddenly over the period.
In 2005, the electronic devices held the largest part by 35% of the total percentage, but after five years there was a sudden reduce in sales to just short of 30%. As for Home Furniture sector, the figures was at 25% in 2005, however, in 2010, less peoples bought the furniture on online this number declined to only 15% of the share.
The Food and Beverage and Video Games markets, by comparison, were obiviously upwards. In 2005, the percentage of those sectors were 22% and 18% respectively. There was an maked improvement in 2010, the food and beverage represented at 32% and video games was the next highest at 23%.
Thank you in advance for helping me improve my writing task 1 in Ielts !

ScreenShot201904.png
