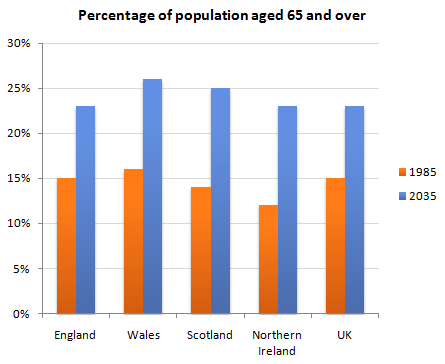
The chart illustrates proportion of the people aged over 64 years old in the United Kingdom. It compare about the percentage in the past (1985) and in the future (2035) in England, Wales, Scotland, Northern Ireland and UK totally.
Overall, the people aged 65 and over was predicted higher in 2035 than in 1985. This case apply for all of parts UK and UK totally. The highest percentage of people who aged 65 years and over is in Wales for both in the past and in the future (more than 15% and more than 25% respectively). On other hand, the lowest proportion is in the Northern Ireland because only around 12% in the past (1985) and around 23% in the future (2035).
The smallest movement happened in England and similar with UK in totally than just 8 percent approximately. Although in Scotland and Northern Ireland are the highest transformation because there is an increase reaching at around 11%.

UK_age_65.png
