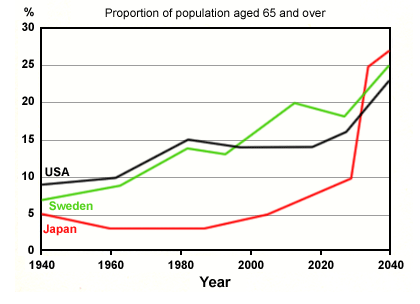
A comparison of percentage of population aged 65 and above from 1940 to 2040 in three different developed countries, a 100-year period is illustrated in the line chart. Overall, all categories witness a significant increase. In any case, while Americans dominated in this reminder question, Japanese people are predicted to be the highest proportion in the last year.
Some moderate changes happened in the first sixty years. In 1940, the proportion of elderly people in USA was higher than other countries (Sweden and Japan) at 9%, 6.5%, and 5% repetitively. What is more, while the figure for the U.S and Sweden rose slightly at almost ten percent after 2 decades, Japanese's proportion fell dramatically to 3.5% people aged 65 and over. The following twenty years, although the percentage for Japanese remained stable, others increased steadily to 15% for USA's proportion and 14% for Sweden percentage.
A more detailed look at the graph reveals that there are some significant alterations in elderly people population. In 2000, old Japanese people had same as proportion as the first year. In contrast, while Americans' percentage dropped slightly, Sweden old people experienced a gradual increase at 15% elderly inhabitants. Afterwards, while all categories will increase dramatically in 2035, their percentage are forecast to be slight rise at the end of the question period at 22% for Japanese which is the highest percentage for elderly people, 25% for Sweden people and 23.5% for Americans.

people_aged_65_and_a.png
