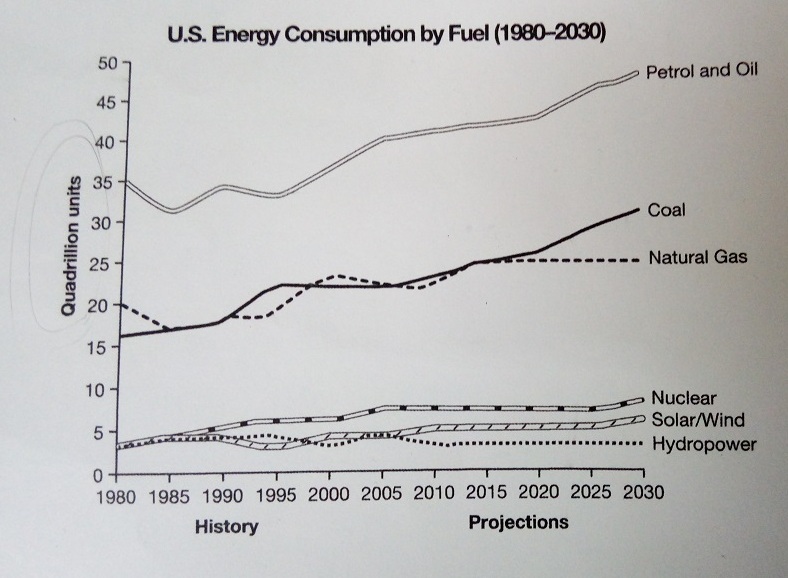
The graph below gives information from a 2008 report about consumption of energy in the USA since 1980 with projections until 2030.
Summarize the information by selecting and reporting the main features, and make comparisons where relevant.
Please help me correct or make the sentence more beautiful. Thanks!
My writing:
The line graph compares six categories of energy consumed and will be consumed in the US over a period of 50 years.
It's clear that total amount of energy consumed increase considerably between 1980 and 2030. The most dramatic change was seen in petrol and oil and Coal. Petrol and oil takes the largest part of all energy consumed.
In 1980, around 35 quadrillion units come from petrol and oil. Coal and Natural gas, which are the second largest sources of energy consumed, are responsible for about 20 quadrillion units. Nuclear, Solar/Wind and Hydropower, which account for least parts, stood at around 4 quadrillion units.
By 2030, all types of energy are predicted to be consumed more. Consumption of Petrol and Oil is expected to reach over 45. Coal is also predicted to rise considerably, to over 25. Natural Gas has a small increase by 5 quadrillion units. Nuclear, Solar/Wind and Hydropower will increase within 3 quadrillion units.

TOPIC
