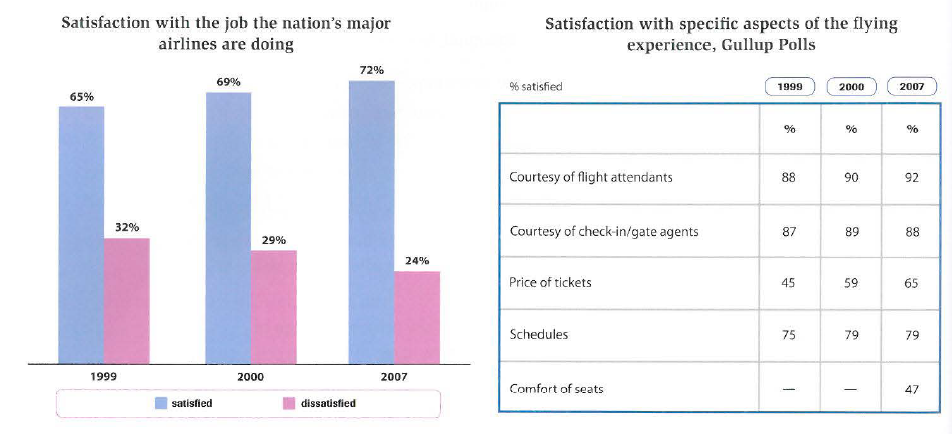
The chart and table below show customer satisfaction levels in the US with airlines and aspects of air travel in 1999, 2000, and 2007
The bar chart and table inform the percentage of the passengers' satisfaction and the aspects which are related with the flight experience in the US in 1999, 2000, and 2007. Overall, the customers were getting more and more satisfied with the airlines and the satisfied level of the flight aspects were above a half in 2007
In 1999, sixty-five percent of the customers were satisfied with the airlines. There is a slight increase by four percent in the next following year. Then in 2007, it reached a peak at 72 percent. Back in the beginning of the period, the unsatisfied passengers' level stall at 32 percent. In 2000, there is a slight decrease by 3 percent. It can be seen that the satisfactory level had an upward trend while dissatisfied level had a downward trend.
The flight attendant and price tickets had a similar upward trend and it reached peak at the same year in 2007. The former had 92 percent while the latter had 65 percent. There was no significant difference of satisfied level for check in agents and stayed at 88 percent as the median value. Schedules satisfaction level had 75 percent in 1999 and had the same number in 2000 and 2007. The data for comfort of seats factor started in 2007 with 47 percent.
(218 Words)

satisfaction.png
