Hello, everyone! Yesterday I found this Forum and I was so happy cause I am just preparing for the coming IElTS. It's indeed so kind adn helpful of you to give us advice on these essays.
Unfortunatelly,so far I haven't got the sense that what can be called a perfect writting for task 1,although I have read many examples.It seemed that the more I read,the more confused I got since different people have different writing styles. I am so frustrated and I really need your help,guys.
This is my writing for a task 1 exercise. Woud you please help to correct it? What band can I get for this? Looking forward to your replies and any suggestions are appreciated and welcome.
Thanks very much in advance~~~~.
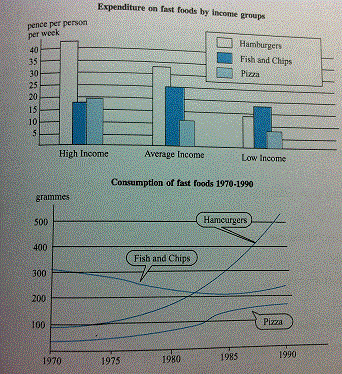
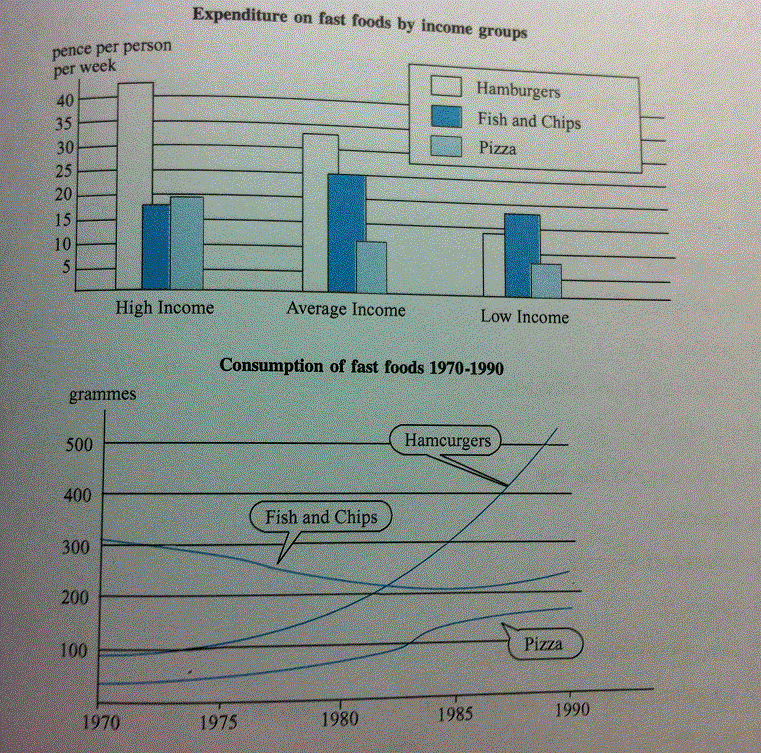
The bart chart gives information about the money expended on fast foods by people with different levels of income while the line graph illustrates the amount of 3 types of fast foods consumed from 1970 to 1990.
According to the bar chart,the expenditure on humbergers declines with the decrease of people's income.Over 40 pence and 33 pence is spent on humbergers weekly by people with high and average income respectively,while the average figure for low income is around 14 pence.Similarly,cosumers tend to spend less money on pizza when their income drops,with only 19,11,and 8 pence spent on pizza evey week by a high,an average and a low income owner respectively.(I think this sentence is not correct,but I do not know how to put it).Nevertheless,unlike hamburgers and pizza which are more popular among high salary groups,fish and chips are the favourite fast foods for average salary cosumers.(25 pence per person per week).Both high income and low income groups pay under 20 pence on average.
As seen from the line graph,the consumption of hamburgers saw an upwards trend throughout the 3 decades.More specifically,the figure rose dramtically from 100 grammes to over 500 grammes by 1990.Correspondingly,the amount of pizza consumed also increased,but less steeply from approximately 40 grammes in 1970 to 170 grammes.On the other hand,fish and chips,the largest consumed fast foods in 1970(over 300 grammes) exprienced a gradual decline ,ending at 240 grammes legged far behind by hamburgers.
Overall,high income groups spend the largest money on humburgers which were consumed the most among the 3 kinds of fast food after the year 1982.(I guess this sentence is not well put.T_T)
I think I write too much, and I have no idea which sentences are unnecessary and can be eliminated...
Thank you for your time~~~~~~!

IMG_0257.gif
IMG_0257.gif
