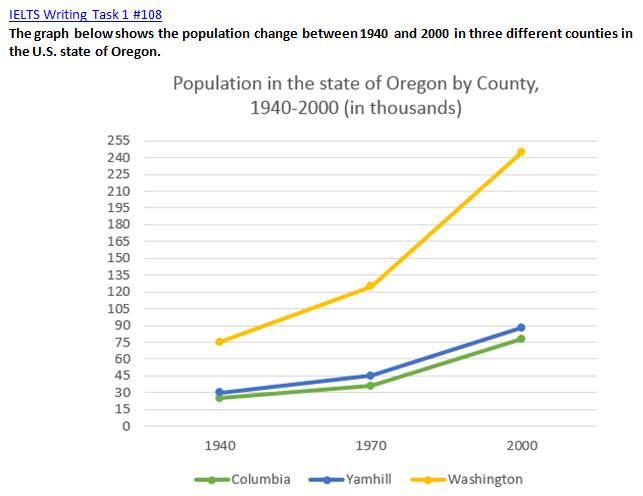
A breakdown of the figure for the population in three diverse countries in the U.S. state of Oregon between 1940 and 2000 is showed in the line chart. It is measured in thousand. As per chart, the data is divided into three parts: Columbia, Yamhill and Washington. It is important to notice that the percentage of Washington broke a record as the highest level. The number of all countries was seen a gradual upward over the time frame.
The proportion of the population in three areas increased gradually over 6 decades and reached their highest proportion in 2000, but Washington's population was always the highest level. While a gap between Columbia and Yamhill's level had narrowed down, the converse will appear to be true for a gap between those countries with Washington's proportion.
Between 1940 and 1970, the level of population in three countries rose gradually. That was followed by a period of 3 decades, Yamhill and Columbia' population increased. Interestingly, the number of Colombia's population in the end of period was the same as the number of Washington population had been at the beginning of the period, at 75,000.

4.png
