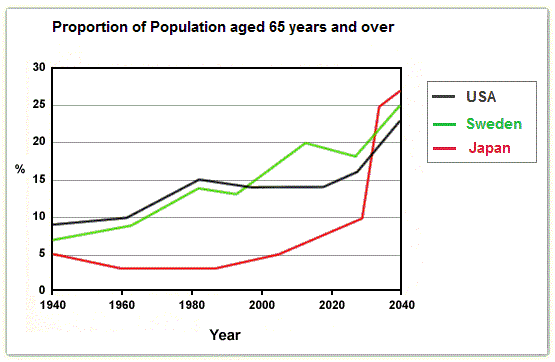
The below graph shows the proportion of the population aged 65 and over between 1940 and 2040 in three different countries, SUA, Sweden and Japan.
150 words.
numbers of elderly citizens
The line graph presents the rate of citizens aged 65 and over among three different countries, USA, Sweden and Japan in a period of 100 years length time.
In 1940, the elderly population from SUA and Sweden was at approximately 9% and 7% respectively. Subsequently, the percentage of elderly slightly increased in both West countries until 1980, where followed a slight fall. The rate of elderly national of SUA and Sweden met around 1998 at approximately 14%. However, Sweden 65 aged nationals started to increase sharply reaching 20% in around 2010. Whereas SUA elderly population kept a steady rate. Nevertheless, in 2020 thinks will tale a turn over of the situation for both west countries, as the percentage of elderly ageing 65 and over will rise to approximately 23% for SUA and 25% for Sweden in 2040.
Although, in Japan, the proportion shown in the graph regarding East elderly nationals is a slight fluctuation. In 1940, the rate was at 5% but afterwards slightly decreased until 1960 and 1990 approximately. However, from then kept rising and in 2020 will increase sharply and will surpass the percentages of SUA and Sweden, reaching the peak at 27% in 2040.
All in all, the percentage of elderly population among them three countries, SUA,Sweden and Japan, fluctuate and will increase gradually to 2040.Holt Educational Consultant - / 16009 Ana, we need the graph for the essay to compare your work to. You should know the rules by now. The image always accompanies your IELTS Task 1 essay. Otherwise, how can we score you properly and point out the problems in your data presentation? The general comments on your work will only get you so far. Anyway, here are the general comments for your work.
The main problem with your essay is that you did only the most minimal amount of work in order to present the readily seen information from the graph. Why do I know that? I know it because of the mechanical detailing that your paragraphs contain. There is no sense of real analysis and understanding of the graph you were provided. I am sure that there was more to the graph than just what you presented here. I'll offer more comments about that when I finally see the graph.
You also have a problem with offering an expanded opening statement and concluding paragraph. You need to provide more insight in those paragraphs in order to increase your possible score. Don't just say it in 2 sentences. Try to say it in in 3 sentences so that you can at least offer a glimpse into how you additionally understood the information you have been provided.
I will not score your essay for now. I feel that it would be unfair to do so without having seen the way that you handled the graph information presentation. I hope you can upload the graph soon for additional comments and advice for your continued improvement.
Hi Ana-Mariana, you actually will get feedback fully so that you attached your picture of what you reviewed. You are only gonna obtain the feedback generally. Firstly, you should merge between your paraphrase of the question and the overview in the first paragraph. My reason is because a good paragraph should have at least 3 sentences. Besides that, you are supposed to play safely. I mean that because you will fight the time when you take the real test, you should write the overview as quick as possible. That element has the high point so that you can tackle with that problem first.
Apart from that, your body paragraphs were less interesting. I said that because you only describe the information like listing the data. You cannot get the high score because you missed the essential clue in the writing task 1. I only remind you that our job in the writing task 1 is comparing figures, not to display the data separately. When you wanna present the data in the diagram, you are supposed to make comparisons. You can do it easily if you can group well. Therefore, before you start writing this, you should analyze the data to know what you explain in each paragraph.
Hopefully, those can finalize your writing
GOOD LUCK
@mariana13
Hi, I think you need to make comparisons as oppose to stating the figures only. Start with sorting and grouping to find the big, over arching 'theme' then make comparison and elaborate from there. This will make your paragraph more solid
hi all. First thank you all for critiques, it really helps.
I attached the graph here in the comment as I can not edit the essay to add it up on the body essay.

Academic_IELTS_Writi.jpg
Holt Educational Consultant - / 16009 Ana, do you see how the graph is arranged chronologically by year and how the percentage discussions followed suit? There is a reason for that. You were being given an opportunity to discuss the graph by bracket. That means, doing a continuous comparison of the data by grouping the information presentation per paragraph. That way, you present a clear analysis covering at least 2 groups of years. Or, you could have discussed the first 3 years together, then the next 2 years, and then finally the last year which is forward looking, all as separate paragraph discussions. This could have increased your task accuracy and grammar range scores significantly because you would have written more words that hopefully, would have translated into a better description of the graph and increased understanding for the reader. That said, the possible score for your essay, based upon my previous, applicable comments and comparison of your work with the current chart, would be a 5.

