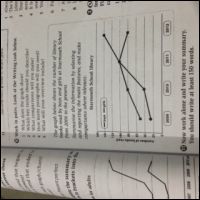
The graph gives information about the number of library books read by boys and girls at Starmouth School. There are two categories that shown based on the chart. The first one is amount of books read by students, and the second one is four-year period about the statistic. Overall, amount of books read by girls reached a peak in 2012 and the boys reached a top in 2011.
According to that chart, a number of books read by girls increased gradually on the 2009 - 2010, which are thirty-five books. It was followed by another slightly rise in the next year, among 2010 - 2011 on twenty books. However, the girls read books immediately during 2011 - 2012 for forty books and it made this period to be a top list position. Due the fact of that condition, it made them to be a sharp rise statistic based on the chart.
According to the chart, amount of books read by boys increased slowly during 2009 - 2010, which are fifteen books. But, there was followed by a dramatic rise on the next year among 2010 - 2011 on sixty books and also it reached peak condition. However, there was a sharp fall on the next year, which are on 2012 and the statistic of boys condition become fluctuated during 2009 - 2012.

281741_1.jpg
