the job market divided by gender and specific of a job
Question: The two pie charts below show some employment patterns in Great Britain in 1992. Summarise the information by selecting and reporting the main features, and make comparisons where relevant.
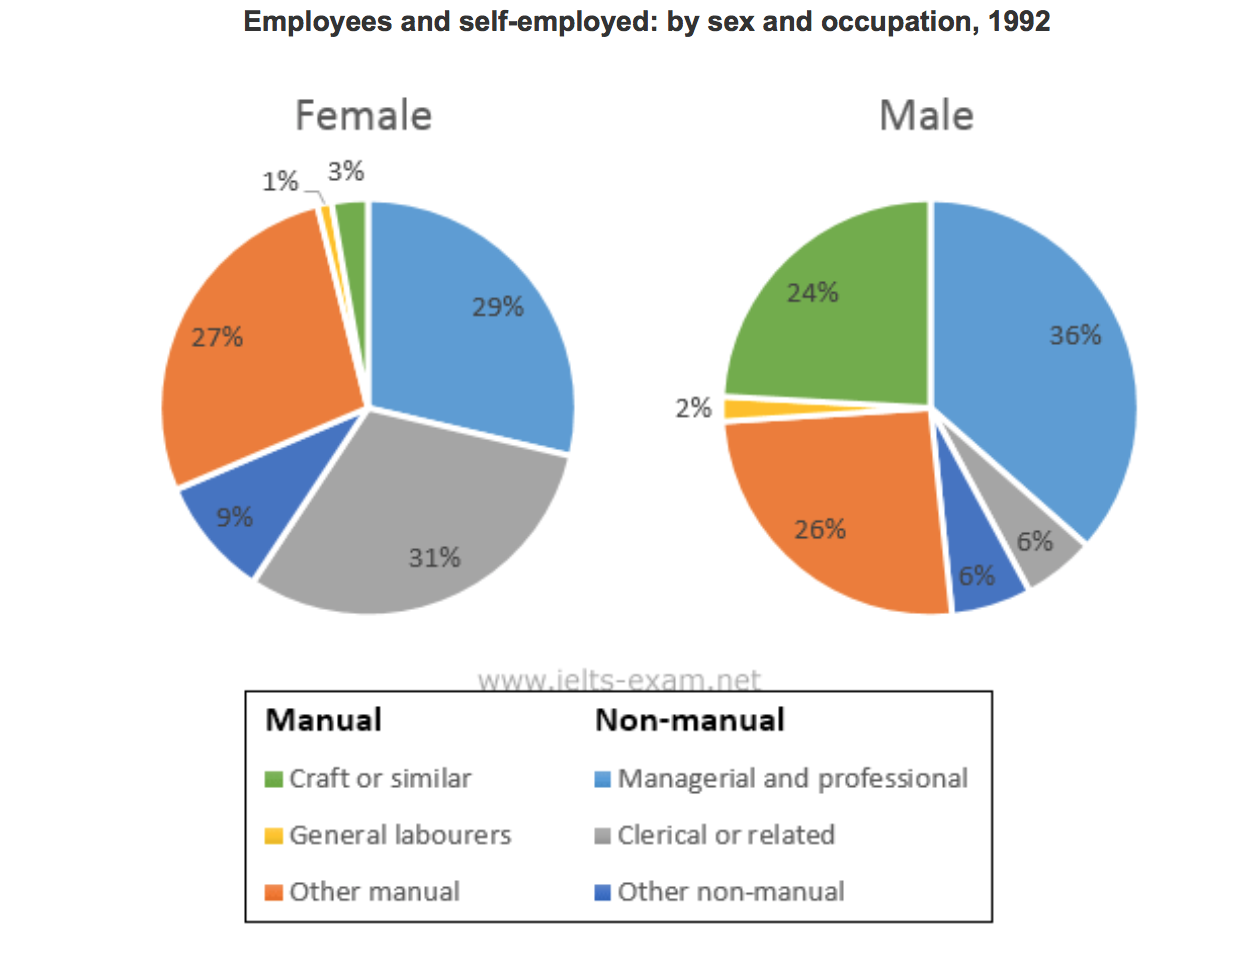
The above pie charts illustrate the structure in job market divided by gender and job nature in the UK in 1992. Overall, most of the female employees did the non-manual job while manual work is the dominant occupation among men.
First, the major sector of women works in clerical or related job as opposed to managerial and professional work for men, in terms of non-manual job. Clerical or related work account for slightly above 30% shown in the chart about women, whereas only makes up 6% among male employees. Instead, more than 36% of male works in managerial or related work, but that only accounts for 26% in women.
Second, regarding the manual employment nature, the items called other manuals account for the most proportion in both female and male, while general labourers devoted to the least. Other manuals item makes up 27% for female while 26% for male, and general labourers only account for 1% and 2% for women and men respectively.
In brief, the employment pattern in manual nature shares similarity between men and women, but the non-manual nature shares differences
Thank for all of you.

ieez_201807.png
