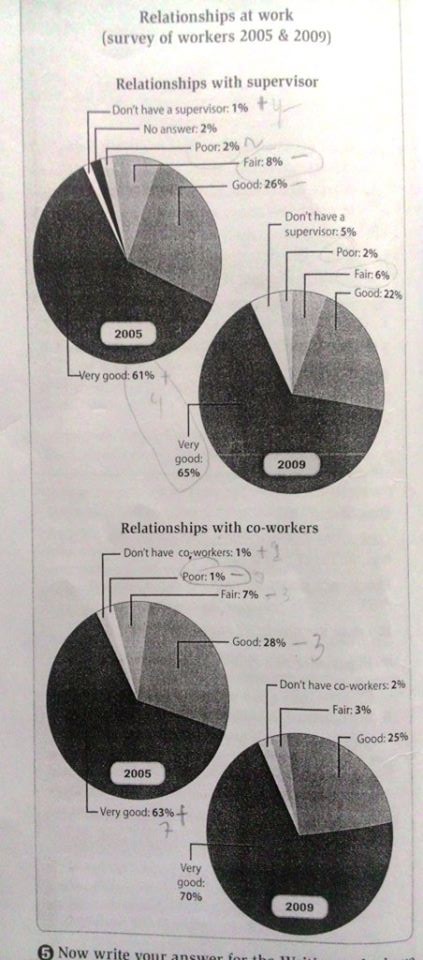
The breakdown of a comparison of two surveys representing the employees' relations with their supervisor and co-workers from 2005 to 2009 is illustrated by the pie charts. This survey is measured in percentages. Overall, it is obviously seen that the most significant results in the charts show that the workers have 'very good' relationship with both partners.
According to the first chart, just over three fifths of occupants had 'very good' relation with their supervisor in 2005, and this trend changed better by 3% of increase. Although in the same year 26 % of workers, who had 'good' interaction, fell to 22 % in the next four years. In addition, a very small number of proportion and alteration occurred towards fair as well as poor relationship.
Turning to the next chart, 63 % of officers also had 'very good' relation with co-workers and it experienced increase to seven in ten. 2005 also saw that there was good relationship which was owned by 28 % of employees and then it declined of three percent in the end of period.

workbook_unit_7.jpg
