Hello everyone, can someone please help me mastered IELTS Writing Task 1 by commenting on my essay below?
I really appreciate your help. Thank you very much! :)
(1st Paragraph)
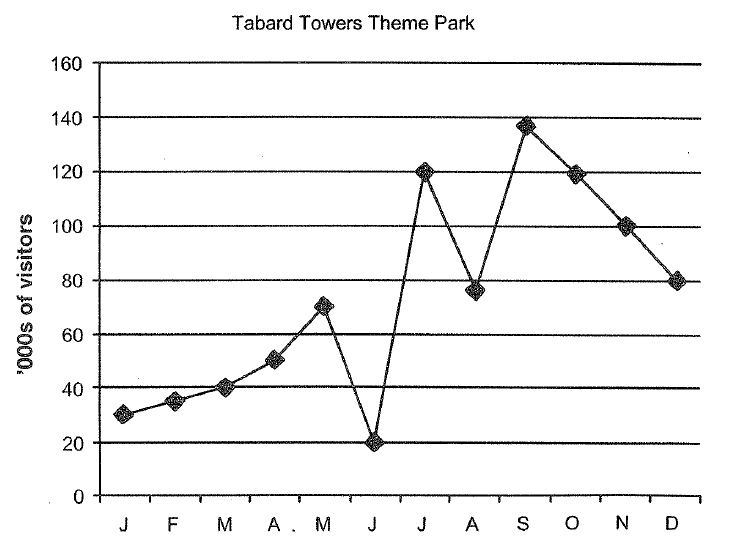
The graph illustrates the number of visitors (in thousands) visited the Tabard Towers Theme Park throughout the whole year which is counted per months. Overall, this park has an interesting variation which includes an erratic fluctuation in the middle year and gradual pattern in several first and last months.
(2nd Paragraph)
The Tabard Towers Theme Park has a gradual increase of visitors since the beginning of the year until May from 30000 to 70000 visitors. Later, the visitors number went up and down wildly with an upward trend towards the end of the year. In June, it has more than 50% sharp drop to 20000 visitors before shooting up to hit 120000 mark in the next month, almost doubled the visitors two months ago. The park's visitor fell back to slightly under 80000 in August and bounce back to almost 140000 visitors in September. After that, it plummeted down periodically to 80000 visitors in December where it reaches over 250% visitors since January.
(161 words)
I really appreciate your help. Thank you very much! :)
Popularity of a theme park
(1st Paragraph)
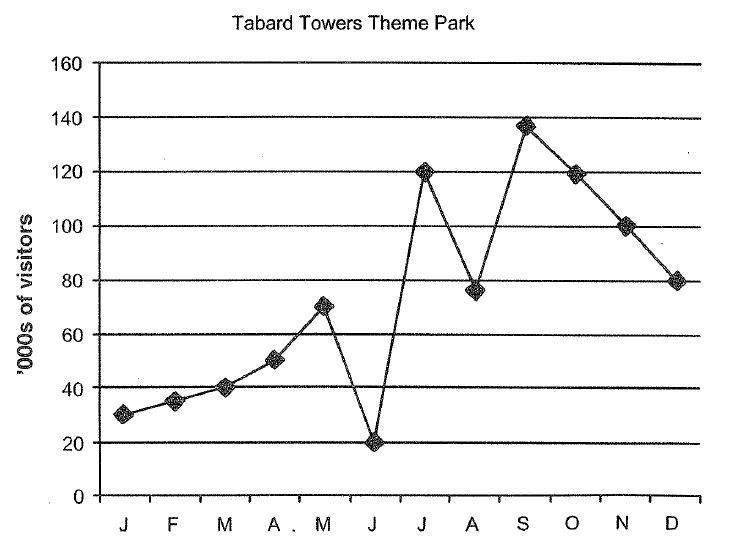
The graph illustrates the number of visitors (in thousands) visited the Tabard Towers Theme Park throughout the whole year which is counted per months. Overall, this park has an interesting variation which includes an erratic fluctuation in the middle year and gradual pattern in several first and last months.
(2nd Paragraph)
The Tabard Towers Theme Park has a gradual increase of visitors since the beginning of the year until May from 30000 to 70000 visitors. Later, the visitors number went up and down wildly with an upward trend towards the end of the year. In June, it has more than 50% sharp drop to 20000 visitors before shooting up to hit 120000 mark in the next month, almost doubled the visitors two months ago. The park's visitor fell back to slightly under 80000 in August and bounce back to almost 140000 visitors in September. After that, it plummeted down periodically to 80000 visitors in December where it reaches over 250% visitors since January.
(161 words)

This is the graph that i need to describe.

