Unanswered [1] | Urgent [0]
  

Home / Writing Feedback   % width   Posts: 7


The table and bar chart show how journey times in a city centre changed after improvement


HuongNg 2 / -  
May 21, 2022   #1

method of transport


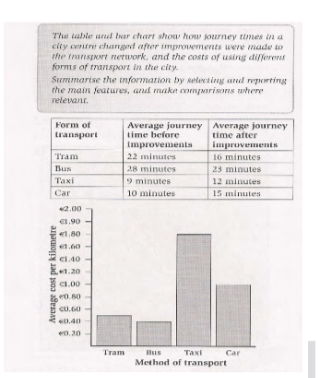
The table and bar chart show how journey times in a city centre changed after improvements were made to the transport network, and the cots of using different form of transport in the city. Summarise the information by selecting and reporting the main features, and make comparisons where relevant.

The table shows how long it took to transport around a city before and after the transport network was improved. The bar graph shows how much it cost to use various types of transport.

Traveling by taxi is the fastest way of getting around the city throughout the innovative process, at 9 minutes and 12 minutes respectively. The car experienced the biggest rise in journey times after improvements to the network, from 10 minutes to 15 minutes. The bus is the slowest form of transportation, it takes passengers 28 minutes around the city, but thank to the improvement the average journey time is decreased 5 more minutes to 23 minutes. The tram witnessed the biggest fall in journey times after improvements to the worldwide innovation, from 22 minutes to 16 minutes.

Passengers who travel by taxi have to pay €1.80 per kilometre which is more expensive than car (€1.00). It takes €0.50 per kilometre for traveling by tram while the cheapest form of transport is bus - just €0.4 per kilometre. In a nutshell, depend on distances, the quickest way to travel is taxi but high-priced, otherwise bus is the best way for the pocket.

  • AnhchupManh.png


Holt  Educational Consultant - / 15384  
May 21, 2022   #2
Since this is a 2 image report, the writer should have used the 4 paragraph reporting format composed of:

Summary overview + 2 trending statements (one for each image)
3 Reporting and comparison paragraphs

There are 3 reporting paragraph because the paragraphs should be composed of:

Image 1 reporting paragraph
Image 2 reporting paragraph
Comparison of information paragraph

The writer has not completely analyzed the images in the manner that would have showed a thorough study of the data and comparison of information. While he did an accurate job of reporting the information from each image in their respective body paragraph, he did not offer a proper analysis of the image based on contrasting observations of the two images when compared side by side.
bhanushali 3 / 4  
May 25, 2022   #3
The overview for the description is missing
overview is important part in task 1
overview can be written in following way,
Overall, due to development in transport network there are changes seen in average time required for travelling. Improvments in travel from trams and bus has led to decrease in average time of journey ,while that of car and taxi have caused increase in average time to travel.
typicallyarimel 2 / 3  
Jun 7, 2022   #4
I cant see an overview here, so consider adding that because it's important.
The way you divide paras and select information is still a bit unorganized and hard to read.
Thats what i think :) Have a nice day!
metyl2945 2 / 2  
Jun 7, 2022   #5
I see you haven't write a overview for it yet, you should consider to include that in every passage since it's important in ielts writing task 1. In the introduction, you should link two sentences with linking words like while. Also, ielts writing task 1 is not really asking for a conclusion, you should write an overview instead of it. In the nutshell is also inappropriate for a IELTS test.

That's what i think :>
Chloeduong 1 / 2  
Jun 7, 2022   #6
I think this sentence "... traveling by tram while the cheapest form ..." would need "," before while. And you need to check your spelling again.
defy 1 / 2  
Jun 8, 2022   #7
I'm also a student trying to get better at writing. I don't know as much as the professional writers here so keep that in mind.

Overall it think what you've written is good. But there are some grammatical errors that I think previous users have pointed out. On top of this I think you could also make everything flow a lot better. There are parts of the paragraph that I think you could elaborate on a little more. Just makes the piece flow a lot better and allows you to explain it clearly. ^^


Home / Writing Feedback / The table and bar chart show how journey times in a city centre changed after improvement
Do You Need
Academic Writing
or Editing Help?
Fill out one of these forms:

Graduate Writing / Editing:
GraduateWriter form ◳

Best Essay Service:
CustomPapers form ◳

Excellence in Editing:
Rose Editing ◳

AI-Paper Rewriting:
Robot Rewrite ◳

Academic AI Writer:
Custom AI Writer ◳