Unanswered [1] | Urgent [0]
  

Home / Writing Feedback   % width   Posts: 3


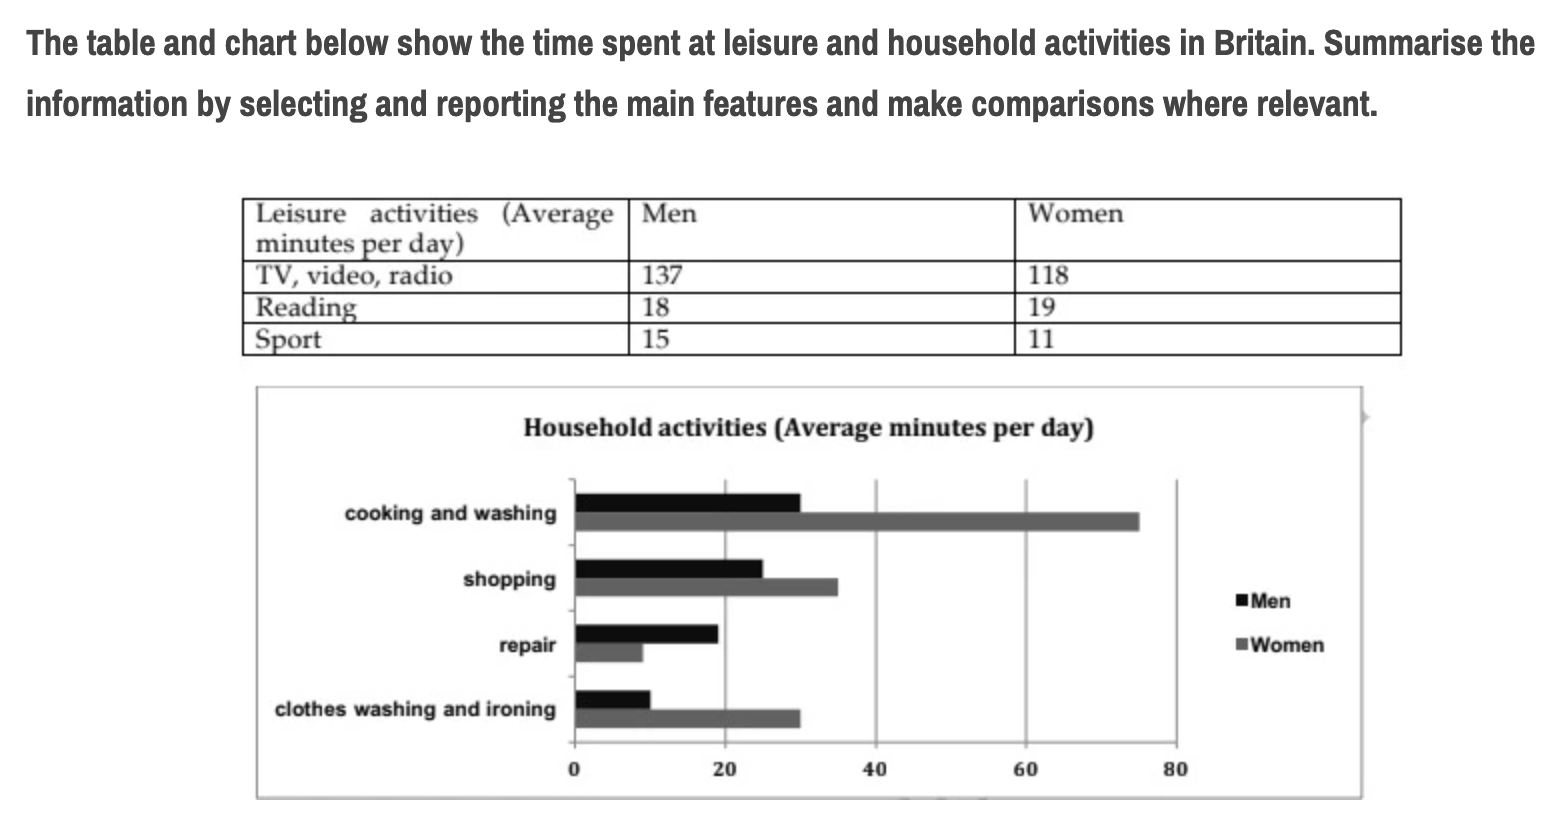
Task 1: The table and chart below show the time spent at leisure and household activities on Britian


Dai Ngoc 1 / -  
May 31, 2023   #1

leisure activities on Britian


The two charts highlight how much time do people spend at their spare and household activities based on gender.
At a glance, it is clear that the number of minutes per day men take on their leisure more than women. Meanwhile, the female figure illustrates that they do housework more than males.

In the table, the figure of men who spent time on TV, video, radio is the most preferable, consisting of 137 minutes. So this figure out performed. They read data standing in second place that is considered at 18 minutes. And sport only has 15 minutes, it is just one-ninth when compared with TV. Turning to the data of women, they have the same TV leisure act with men. The witness of this data is 118 minutes, lower than men 21 minutes. The time spent for reading by women is similar with men, then the sport consists of 11 minutes less than reading 8 minutes.

Moving on the bar graph, only the time spent for repairing on men more than women stand at nearly 20 minutes then the others such as cooking and washing, shopping, clothes washing and ironing that also women is dominant than men. Especially cooking and washing, which are more than nearly three times with nearly 80 minutes and men just take 35 minutes with these activities.

  • Screenshot2023053.png


Holt  Educational Consultant - / 15385  
Jun 1, 2023   #2
The two charts

Incorrect image identification. These are not mere charts. The upper image is a table and the second image was a bar chart. There were differences in the identifiers that should have been used to help you accurately reference what images were provided for comparison and reporting. You also failed to differentiate between the information each image contains, leaving the reader confused by the image references you provided. These errors will affect your TA score negatively. You actually did a pretty good job of reporting the information provided and properly differentiated the images in the reporting paragraphs so perhaps the first error was just an oversight on your part.
ptthao0801 3 / 4  
Jun 1, 2023   #3
@Dai Ngoc
You should have 4 paragraphs for task 1.
You also need to check your grammar and pay attention to your wording.
Ex: "So this figure out performed."-> not an independent clause + too informal.
"the figure of"-> the figure for
"how much time do people spend" > how much time people spend


Home / Writing Feedback / Task 1: The table and chart below show the time spent at leisure and household activities on Britian
Do You Need
Academic Writing
or Editing Help?
Fill out one of these forms:

Graduate Writing / Editing:
GraduateWriter form ◳

Best Essay Service:
CustomPapers form ◳

Excellence in Editing:
Rose Editing ◳

AI-Paper Rewriting:
Robot Rewrite ◳

Academic AI Writer:
Custom AI Writer ◳