putting in money into products in different categories
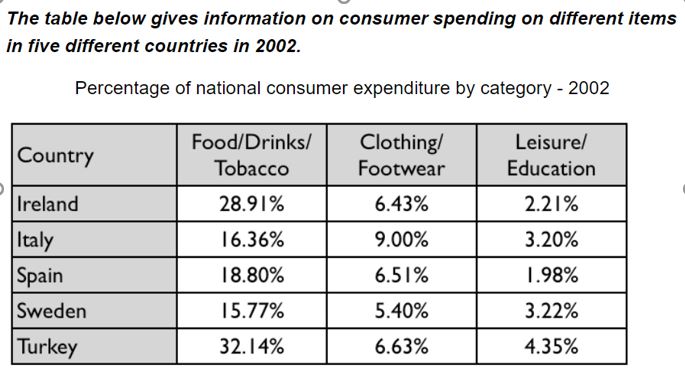
The diagram illustrates the percentage of consumers' cost on various products from five European nations.
Citizens of all researched countries spent the most on the category of foods, drinks, and tobacco. Among the five nations, the three categories together account the most percentage of cost in Turkey.
In each country, people spend more on foods; drinks; and tobacco than the other two categories of the product combined. In Ireland and Turkey, foods; drinks; and tobacco cost people nearly 30% or more money. Even in the rest of the countries, the three items still account for nearly 15% to 19% of their fortune.
For the category of clothing and footwear, all of the countries spent around 5 to 10 percent of the wealth, while consumers from the five nations are only willing to spend around 3%-4% on education and leisure. On the other hand, citizens from Turkey use more than 40% of their money on these three types of products, while Ireland spent about 36% on them.

.JPG
