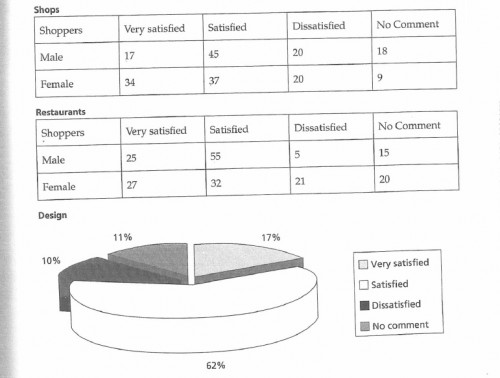
The tables and pie chart illustrate the percentages of satisfactions survey in a new shopping complex in Auckland, New Zealand. Overall, it can be seen that most visitor are satisfied in three survey categories. In any case, restaurants are the most attractive factor in that shopping complex. A more detail explanation about the result of survey follows below.
According to the data, 55% of male visitors are satisfied with the restaurant foods. On the other hand, the female shoppers tend to take pleasure in shopping at approximately 37% in survey. There are a similar number of very satisfied male and female visitors in the restaurants survey at around 25% and 27% respectively.
Turns out to shopping complex complains, there are few customers who has dissatisfaction with the shops category around one in fifth in both genders. Then, in the restaurants category, female sector has seen the highest unpleasant percentages at 21%. Furthermore, the concept of that shopping complex only had 10% complaint from the customer.

writing_34_task_1_pi.jpg
