This is my first writting in here, please help me friends.
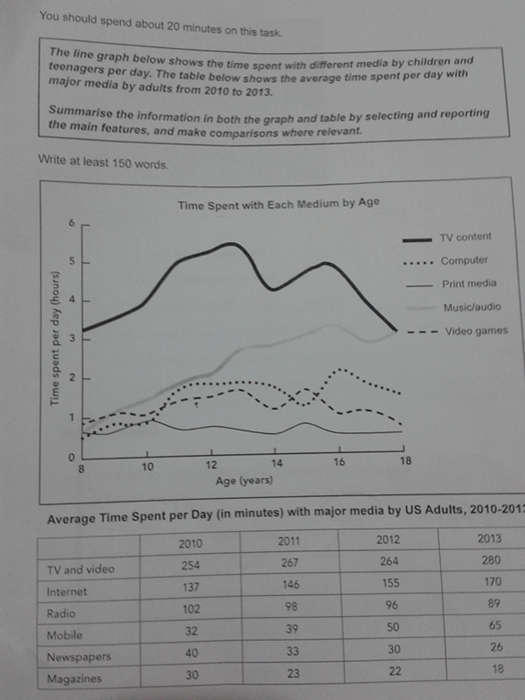
The line graph below shows the time spent wit different media by children and teenagers per day. The table below shows the average time spent per day with major media by adults from 2010 to 2013.
summarise the information in both the graph and table by selecting and reporting the main features, and make comparison where relevant.
The line graph present data about teenagers who spend the time with five variant media per-day in hours and the table illustrates about United State Adults who waste the time with plenty of media per-day in minutes over a four year period, from 2010 till 2013.Overall mostly inhabitant watch television as the best choice to spend their time, it shows between line graph and table.
According from the graph, music and audio are quite popular with 3 hours per-day and become the second options to spend the time among teenagers between 18 years old, in contrast with US Adults prefer spend the time approximately 170 minutes each day with internet than audio visual with 89 minutes in 2013.
Print media such as Newspaper and Magazine are less popular than other media. US Adults spend the time with below 45 minutes each day for over four years and teenagers spend their time with read print media just under an hour each day.

time_spend_teenager_.jpg
