proportion of time spent with phones and tablets
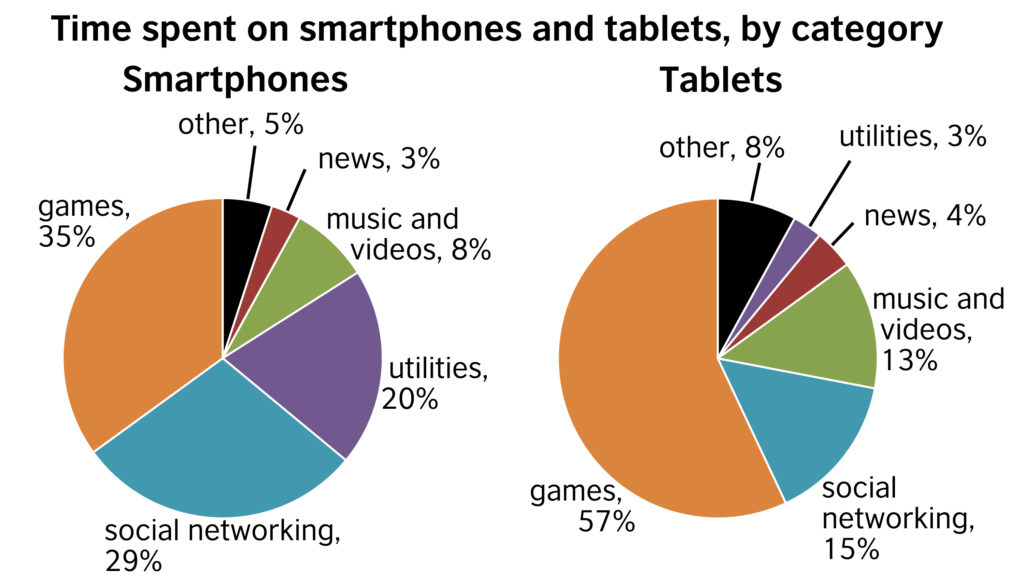
The graphics compare information about the duration which people use for smartphones and tablets.
It can be clearly seen that the proportions of games and social networking account for the largest part on both devices. Whereas, news and utilities take up the least on smartphones and tablets respectively.
Playing games makes up over a third of total time spent on smartphones (35%). Besides, the time of spending on the same on smartphones is more than a half (57%). Then, the second largest percentage of time spent on both devices is still similar, that is social networking. But they use it on smartphones almost twice as much time than they use it on tablets.
When it comes to news, on average people spend the least time on it, just 3% on smartphones and 4% on tablets. Meanwhile, the proportion of time spent on utilities on smartphones (20%) is nearly sevenfold on tablets (3%). In addition, there is not much difference between 2 devices in time consumed on music, videos and other uses.

WritingB2Comparing.jpg
