the propotion of profits made from seven most viewed movies
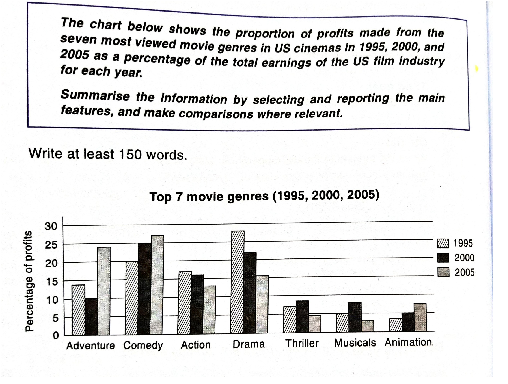
The bar chart illustrates the percentage of profits made from the seven kinds of movies, which were most viewed in US cinemas in 1995, 2000, and 2005.
Overall, it can be seen that the drama genre has the most profit compared to other genres in 1995. In contrast, the animation, thriller, and musical genres have less profit than the other four genres.
Looking at the bar graph closely, one can see that, in 1995 the drama genre had the most profit compared to other genres, which was approximately 30% percent of profits. Dramma was followed by comedy, which was 20% percent of profits, while action was the third highest percentage of profits with 17%.
The adventure was also successful, which approximately 15% percent of profits. In 2000, comedy was the highest percentage of profits with 25%, surging five percent above its 1995 figure. But drama's profits decreased to more than 20% and became the second highest percentage of profits in 2000. An upward trend was also evident that year for a thriller, musicals, and animation films. In contrast, a downward trend was true for adventure and action films. In 2005, comedy remained the most profitable genre and its profits increased to nearly 25%. Also, adventure became the second highest percentage of profits after gaining approximately 25% and the profits from animation films grew too. In contrast, thrillers, musicals, drama, and action films had declined profits.

335618_1_o.png
