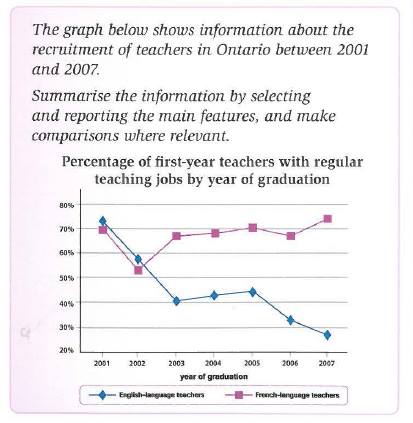
The line graph reveals about the total percentage of the teacher enlisting in Ontario City from 2001 to 2007 which divided two subjects. It is apparent from that information that, English-language teachers decreased significantly while French language teachers despite had experienced decreased but over the period the level increased slightly.
Looking detail on the data showed started in 2001 stood at over 70% accepted as teachers in English subject in which it was the highest rate in the same year. However, two years later total percentages decreased dramatically in which it was losing over 20%. Whereas from 2003 to 2005, total percentages of English teacher accepted in the Ontario City increased slightly around 2 percent than previously but following this, the trend rate sharply falls until a finish under 30% in 2007 .
Turning to total percentages of French language teachers, in 2001 stood 70% was accepted in the Ontario City, however, it dropped to near 50% in the next year. Moreover, the rate was showed increased rapidly more than 20% in 2003. Over the next years to finish in 2007, the percentage rise rapidly in which despite had experienced drop slightly below 70% in 2007 but it peak at over 72% in the last period.

12166071_12231987510.jpg
