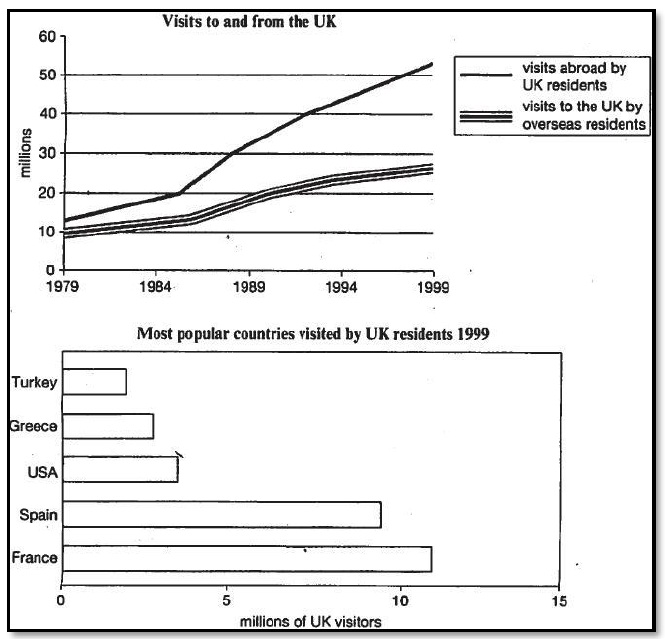
The line chart provides information regarding the number of visitor to and from United Kingdom over two decades from 1979 to 1999 while the bar chart illustrates the country's popularity rated based on their UK visitors number.
The charts below give information about travel to and from the UK, and about the most popular
countries for UK residents to visit.
Summarise the information by selecting and reporting the main features, and make
comparisons where relevant.
==============================================================================
Overall, the rate of overseas people who came to UK never dominated the visiting overseas number arranged by that country's inhabitants. Furthermore, in the last period pointed in the first chart, British' travelling destination spread to 5 countries mostly, and those have a different visitors proportion.
For a more detail look at the first graph reveals more than 10 million travelling abroad conducted by UK residents in 1979, then this number growth smoothly, only approximately by 3 million to the next 5 years. However, the number of international visitors who came to UK which initially stood at 10 million grew more steeply thus this trend led to the gap widening between this two features. Moreover, in around 1985, the number of British travelling to overseas underwent sharper increase while the international visitors who came to UK experienced just a slightly faster growth than their previous change number, caused the distance between them became more and more remarkable .
What is more, looking closely at the bar chart, in the end of the duration regarded in the first chart, France seems the most favorable country destination which chosen by more than 10 million UK visitors. Then, Spain stood at the second favorite visited by just under 10 million travelers from England. In addition, Turkey, Greece, and USA were also listed in the five most popular selected travelling destination countries, however not until 5 million visitors chose them.

uk_visitor.jpg
