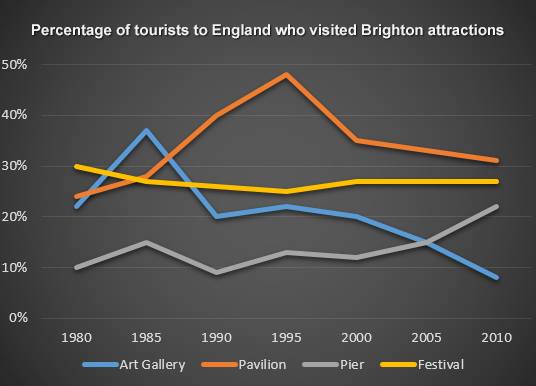
A breakdown of the proportions of traveler who visited Brighton attractions which were Art gallery, pavilion, pear and festival in the UK since 1980 to 2010 is depicted in the line graph. Overall it can be seen that percentages of some attractions tend to increase, while the other fall in the end period of survey.
In 1980 the percentage of traveler who visited art pavilion and pier stood at approximately24% and 10% respectively. 1995 saw a steady rose the pear visitor to around 12% when the pavilion visitor tended to climb significantly to approximately 48%. In the following one a half decade, there were a sharp drop to 32% in the number of pavilion visitor and a dramatic growth to 22% the number of pier.
In contrast, the proportion of people who visit art gallery and festival stood at 22% and 30% respectively in 1980. The next a half decade, both of them decreased slightly to approximately 21% and 25% close behind. In the end of period assessment the proportion of festival rose slowly to around 28%, while the number of art gallery visitor was plunged dramatically to under 10%.

12932608_10201336223.jpg
