Hello! Please kindly help to review my short essay. Thank you so much
========================================================
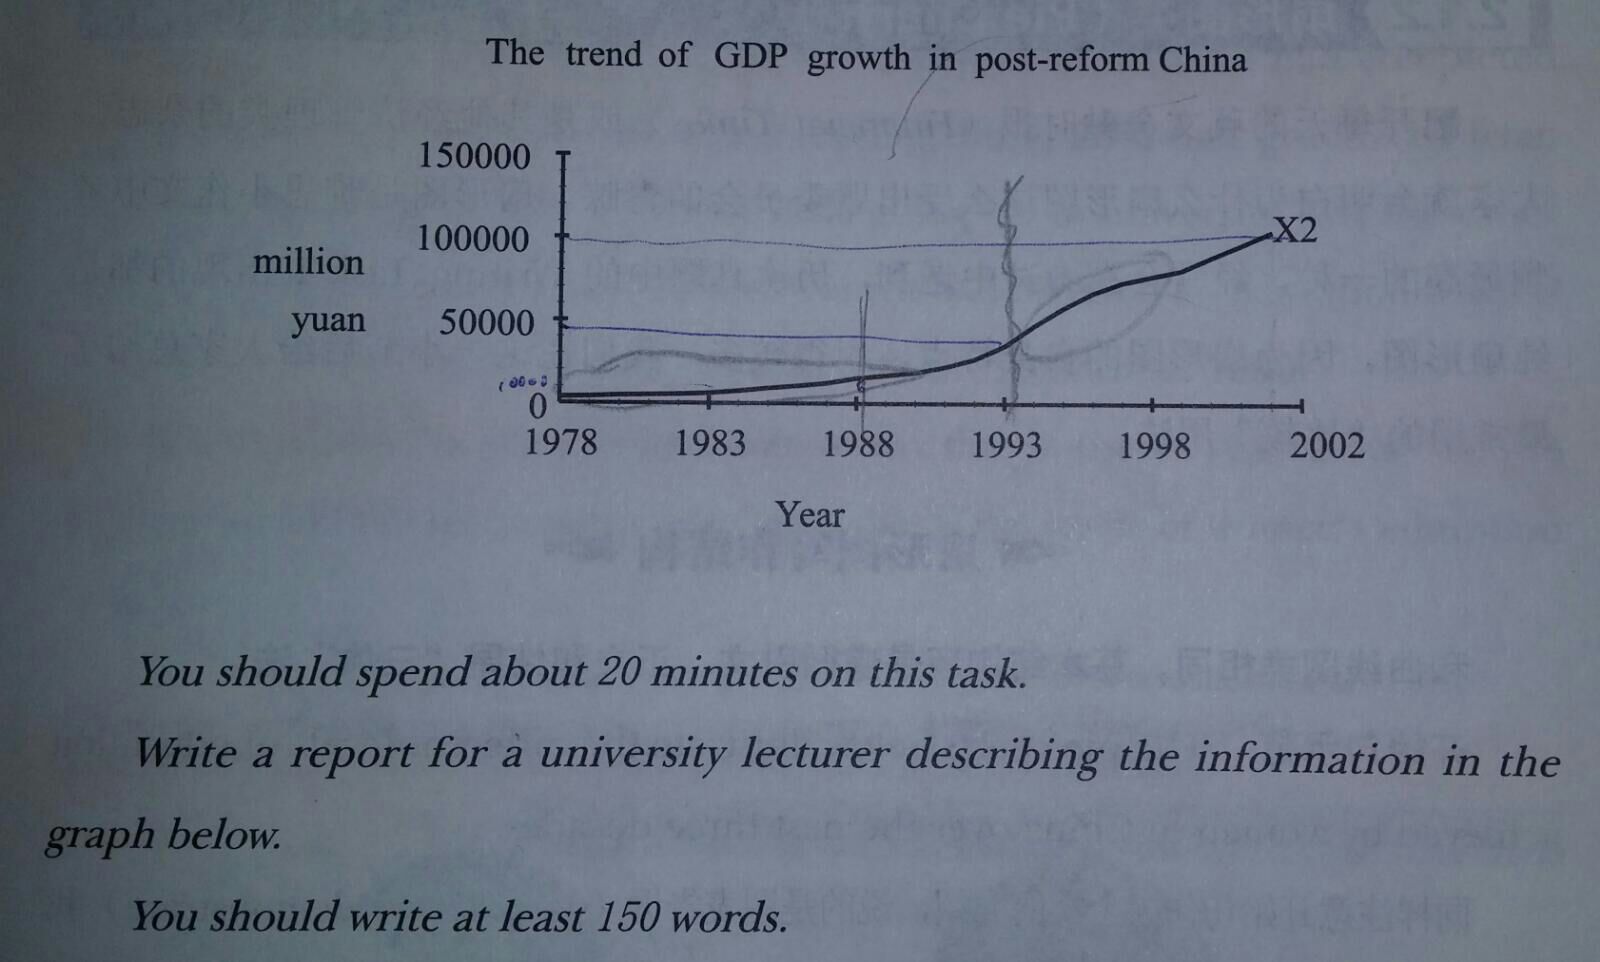
The above graph illustrates the GDP trending in China of post-reform period between the year 1978 and 2002.
The GDP remained steady from 1978 to 1983 and slightly increased afterwards. Starting from 1988, the GDP climber dramatically and reached 100,000 million yuan in 2001.
In 1978, the GDP was approximately 4000 million and showed a modest upward trend. The GDP rose minimally to around 5000 million in 1983. The upward trend continued to be gradual after 1983.
The GDP was around 10,000 million yuan in 1988, it grew 5 times more within the next 5 years and went up to 50,000 million yuan in 1993. By the time of 1998, the GDP already soared to 100,000 million yuan which was 5 times of 1993.
To conclude, it is noteworthy that China had made positive improvement of GDP growth in 1988 and such improvement was particularly obvious from 1993 to 2002 which doubled for the time being.
========================================================
GDP trends in China
The above graph illustrates the GDP trending in China of post-reform period between the year 1978 and 2002.
The GDP remained steady from 1978 to 1983 and slightly increased afterwards. Starting from 1988, the GDP climber dramatically and reached 100,000 million yuan in 2001.
In 1978, the GDP was approximately 4000 million and showed a modest upward trend. The GDP rose minimally to around 5000 million in 1983. The upward trend continued to be gradual after 1983.
The GDP was around 10,000 million yuan in 1988, it grew 5 times more within the next 5 years and went up to 50,000 million yuan in 1993. By the time of 1998, the GDP already soared to 100,000 million yuan which was 5 times of 1993.
To conclude, it is noteworthy that China had made positive improvement of GDP growth in 1988 and such improvement was particularly obvious from 1993 to 2002 which doubled for the time being.

WhatsApp_Image_2017.jpeg
