I'm so I'm so grateful for your help :)
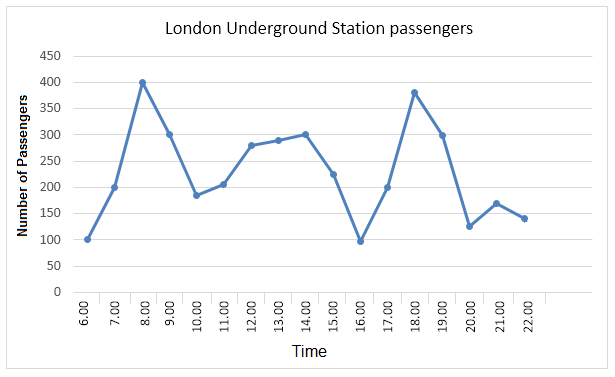
The line graph gives information about the number of passengers using London Underground Station in different times over the course of a day.
It can be seen that, there is a sharp fluctuation in the number of the Underground Station passengers from 6 am till 10 pm, and the times that people are most likely to go to and leave from their workplace are the busiest times of a day, 8 am and 6 pm.
Underground Station's first train starts with a modest number of passengers, at just 100. However, this figure dramatically rises and reaches a peak of 400 people at 8 am. After this the number drops quickly to approximately 200 passengers at 10 o'clock. Between 11 am and 2 pm, the passengers number slightly rises with a plateau of just under 300 people using the station.
From 3 pm to 4 pm, there is a significant decline in the number of Underground subway commuters, with less than 100 people travelling. This figure then increases rapidly to peak at nearly 375 people at 6 pm before dropping sharply to about 125 passengers at 8 pm. After 8 pm, just around 150 passengers using this station in London.
the number of Underground Station commuters
The line graph gives information about the number of passengers using London Underground Station in different times over the course of a day.
It can be seen that, there is a sharp fluctuation in the number of the Underground Station passengers from 6 am till 10 pm, and the times that people are most likely to go to and leave from their workplace are the busiest times of a day, 8 am and 6 pm.
Underground Station's first train starts with a modest number of passengers, at just 100. However, this figure dramatically rises and reaches a peak of 400 people at 8 am. After this the number drops quickly to approximately 200 passengers at 10 o'clock. Between 11 am and 2 pm, the passengers number slightly rises with a plateau of just under 300 people using the station.
From 3 pm to 4 pm, there is a significant decline in the number of Underground subway commuters, with less than 100 people travelling. This figure then increases rapidly to peak at nearly 375 people at 6 pm before dropping sharply to about 125 passengers at 8 pm. After 8 pm, just around 150 passengers using this station in London.

rat5pt11.png
