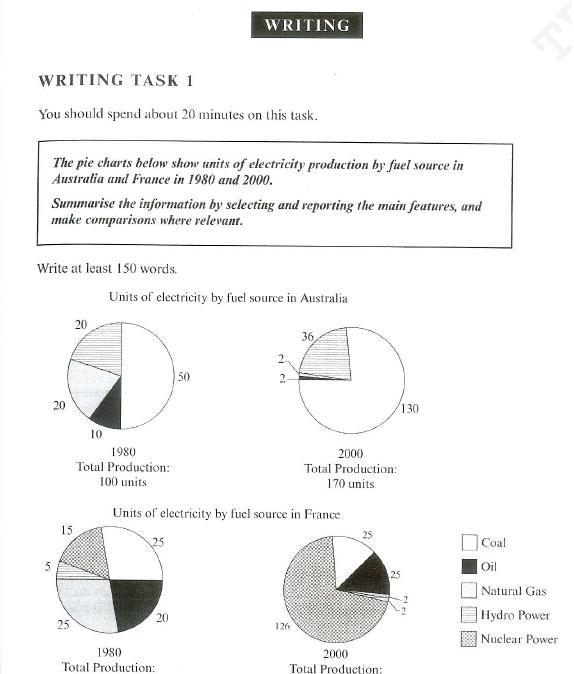
The given four pie charts show units of electricity production by fuel source in Australia and France in 1980 and 2000.
According to the first and the second pie charts in 1980 in Australia half of all producing electricity was Coal which were 50 units. Hydro power and natural Gas more less than Coal had 20 units. A small fraction of electricity production accounts for oil only 10 units. In 1980 total production were 100 units.
After two decades using of Coal increased almost three times to 130 units. Hydro power rise to 36 units. In that case consumption of Natural Gas and Oil fuels decreased to 2 units. Total production of electricity in 2000 were 170 units. 70 units more than in 1980.
It can be seen in the third and the fourth pie charts consumption of fuel source in France to produce electricity in 1980 and 2000. In 1980 25 units of electricity produced by Coal twice less than in Australia. Consumption of Natural Gas like fuel source were more than in Australia to 5 units it were 25 units. Oil was used in France twice more than in Australia
approximately 20 units. Nuclear Power was used in France to produce 15 units of electricity but in 1980 in Australia there were not consumption of nuclear power. Only 5 units were produced by hydro power. Total production in 1980 were 90 units
In 2000 consumption of Nuclear Power during two decades increased rapidly from 15 to 126 units. Producing electricity by Coal didn't change and remain 25 units. Oil uses increased slightly to 25 units. Consumption of two fuel source Hydro power and Natural Gas decreased to 2 units. Total production of electricity were 190 units
In conclusion between two countries Australia and France were different ways of producing of electricity. Australia in 2000 prefere use Coal to produce electricity. But in France at the same time there were used Nuclear power as a fuel source.

c
