Hi! This piece of writing is for IELTS Writing Task 1. Comments/criticism/suggestions please!
Prompt: The table below shows the numbers of visitors to Ashdown Museum during the year before and the year after it was refurbished. The charts show the result of surveys asking visitors how satisfied they were with their visit, during the same two periods.
Summarise the information by selecting and reporting the main features, and make comparisons where relevant.
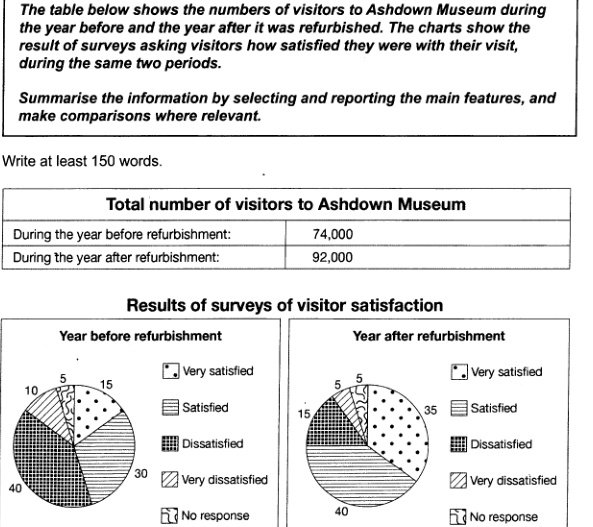
Essay: The table gives information about the amounts of visitors received by Ashdown Museum during the years before and after its renovation. The chart indicates visitors' degrees of satisfaction during the two periods.
Overall, after refurbishment, the museum received more visitors and provided better visit experience. The museum saw a significant reduction in the share of visitors who reported "dissatisfaction".
Visitor numbers rose from 74,000 to 92,000 after renovation, a significant increase by almost a quarter. Another remarkable gain that can be observed is the percentage of visitors who felt "satisfied" or "very satisfied". This proportion has been less than half before refurbishment, but soared to 75% during the year after refurbishment, with 40% being "satisfied" and 35% feeling "very satisfied".
Negative feedbacks, on the other hand, shrank after renovation. 40% of the visitors had rated their experience as dissatisfactory and another 10% had felt worse during the year before the museum was renovated. After the renovation, dissatisfaction levels slumped to 15% while the percentage of visitors feeling very dissatisfied dropped to 5%.
Summarise the information from the provided table
Prompt: The table below shows the numbers of visitors to Ashdown Museum during the year before and the year after it was refurbished. The charts show the result of surveys asking visitors how satisfied they were with their visit, during the same two periods.
Summarise the information by selecting and reporting the main features, and make comparisons where relevant.
Essay: The table gives information about the amounts of visitors received by Ashdown Museum during the years before and after its renovation. The chart indicates visitors' degrees of satisfaction during the two periods.
Overall, after refurbishment, the museum received more visitors and provided better visit experience. The museum saw a significant reduction in the share of visitors who reported "dissatisfaction".
Visitor numbers rose from 74,000 to 92,000 after renovation, a significant increase by almost a quarter. Another remarkable gain that can be observed is the percentage of visitors who felt "satisfied" or "very satisfied". This proportion has been less than half before refurbishment, but soared to 75% during the year after refurbishment, with 40% being "satisfied" and 35% feeling "very satisfied".
Negative feedbacks, on the other hand, shrank after renovation. 40% of the visitors had rated their experience as dissatisfactory and another 10% had felt worse during the year before the museum was renovated. After the renovation, dissatisfaction levels slumped to 15% while the percentage of visitors feeling very dissatisfied dropped to 5%.

IELTSWriting1Ashd.png
