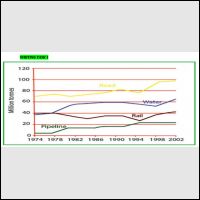
The graph above shows the quantities of goods transported in the UK between 1974 and 2002 by four different modes of transport.
The line graph shows information about the quantities of goods in million tonnes based on four different types of transports from 1974 to 2002 in the UK. Overall, there has been an upward trend in various modes of transport figures over the period and the most significant growth was road.
During this period, transfer of goods by rail and pipeline only under 50. Between 1974 and 1994, the amount of items in pipeline rise gradually From 5 to 25 then steady until 2002. In contrast, the figures of pipeline was an annual decrease until reached the bottomed at 30 in 1994. However, in the next quarter, it increased by more than 10 and reached a peak at 42 in 2002.
The transportation by water stood at 38 while road 70 in 1974. Then, there was a slight increase for both until 1978 and followed by went up a lot to 58 for water while road decline slightly in 1982. There was remained constant for water before 1994 but then fell back to 55 in 1998. Meanwhile, road increase enormously, although there was fluctuation before it achieved the highest at 94 in 2002.

290069_1.jpg
