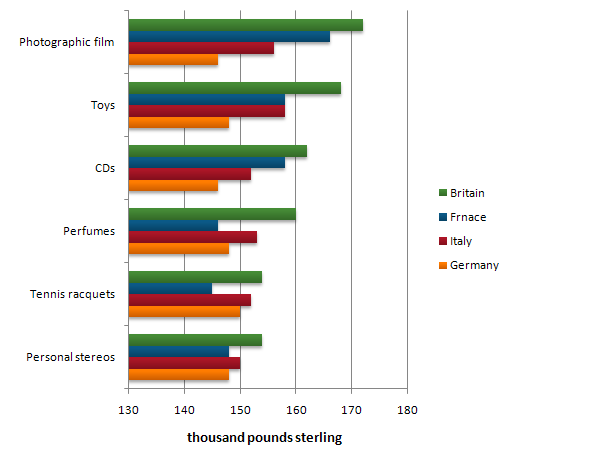
The chart below shows the amount spent on six consumer goods in 4 European countries. Write a report for a university lecturer describing the information shown below.
The graph illustrates the differences in spending amount of 6 consumer items categorized into 4 European countries namely Germany, Italy, France, and Britain. It is noticeable that the consumption of each good in Britain plays the largest parts.
To take a closer look, the money spent on personal stereos, tennis racquets and perfumes are relatively less than this of the rest. While France pay least in these goods, Britain maintain its leading position and reach its peak at 160 thousand pounds in perfumes.
The spend on CDs, toys and photographic film is much higher in France and Britain. These two lead in CDs with the spending amount at approximately 158 and 160 thousand pounds respectively. Meanwhile, Italy and France pay the same money on toys at around 158 thousand pounds. The most excessive figures are the British spending amount on toys and photographic film with around 168 and above 170 thousand pounds.
(152 words)

Untitled.png
