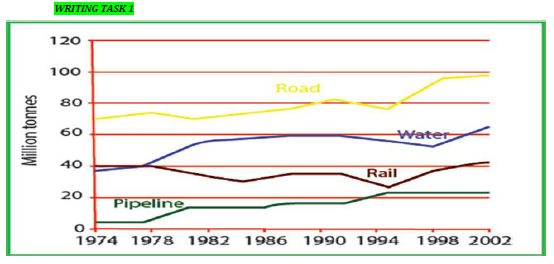
The graph above shows the quantities of goods transported in the UK between 1974 and 2002 by four different modes of transport.
The line graph gives the information about how much goods distributed by various types of transportation in the UK between 1974 and 2002. Overall, it can be seen that most of all kinds of transportation fluctuated but pipeline was an upward trend. Road is the most popular mode of transport among others.
In 1974, about 70 million tonnes of goods distributed by road and over the 28 years still the highest amount of goods were delivered which reached a peak at under 100. In contrast, transportation with the pipeline is the lowest among others. Started from under 10 in the first year and ended at above 20 in 2002.
Rail and water had the same starting point in delivering goods at above 40 million tonnes. From 1982 to 1994, transportation by water stabled at around 60 while rail fluctuated and bottomed at above 20 in 1994. In 2002, distribution of water is higher than rail about 65 and 40

line graph
