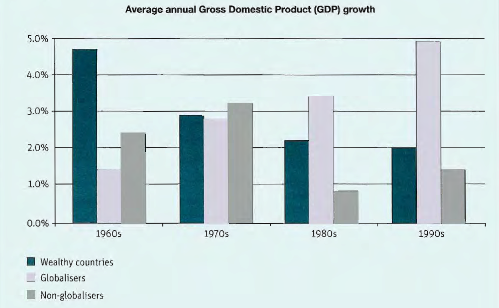
The graph below shows the average growth in domestic product in wealthy countries, countries that have adopted a global approach to business and countries that have not.
First in all, the chat depicts the average annual Gross Domestic Product (GDP) growth over ranging 1960-to-1990. There are mentioned three aspects; wealth countries, globalisers and non-globalisers.
A more detailed look at the bar chart informs that wealth countries achieved over 4.0% in 60s and declined sharply under 3.0 percent in 1970. Moreover, wealthy countries had dramatically decrease with 2.2% in 1980 and got the lowest percentage in 1990 (2.0%).
Moving onto globalisers countries, in 1960, the percentage of globalisers had 1.4%, while significant increased to over 2.5% in 1970 onwards. What is more, globalisers countries sat a peak in 4.9% in 1990.
Turning to the data non-globalisers countries had 2.3% in 1960 and increased gradually in 1970 (3.2%). Standing in contrast, in 1980, the percentage of non-globalisers feel significantly to 0.8%, while there was dramatically increase to 1.5$ in 1990.
If we analyze the data which informs that the globalisers countries was growing continuously and in the last period got a peak in over 4.5%. However, the wealthy countries year-by-year declines ironically from 1960 achieved 4.8% to 1990 reached 2 percent.
In my eyes, the countries which were adopting globalisers would get the highest percentage in the 1990, while the countries which were following non-globalisers had random percentage from 1960 to 1990. However, we have to consider with the wealthy countries which had dramatically decreased year-by-year.

