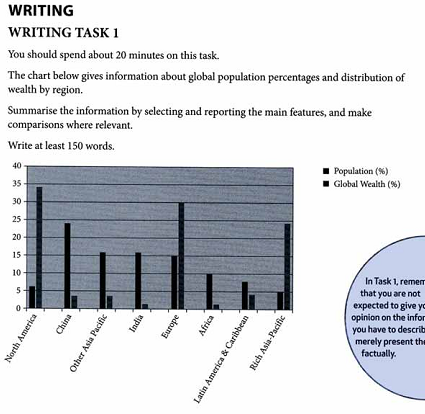
The presented bar chart highlights information about world population and wealth distribution in various regions, and counted in percentages. Overall, it can be seen that the majority of wealth countries have a less population, whereas most of the lowest income in a reverse.
With regarding to the data, the three countries of prosperous nation including Europe and Rich Asia-Pacific accounts for higher income with the top rank is placed by North America at more than a third. While the lowest income are placed by Africa and India at very small number. It is shown a very large gap of population and wealth level in North America by approximately 1:6.
On the other hand, there is a similar proportion in the number of population in three areas (Other Asia Pacific, India, and Europe) at about 15 percent. Following that, although it records the high population in China, Other Asia Pacific, and India, those just have wealth level at under 5 percent. However, Latin America & Caribbean witnesses a short distance both two categories by 1:2.

TASK_1SC01.png
