IELTS part 1: Wheat exports (line chart)
Please refer to our private review services since you have specific review specifications. Free review only covers general personal statement guidelines. Thank you.
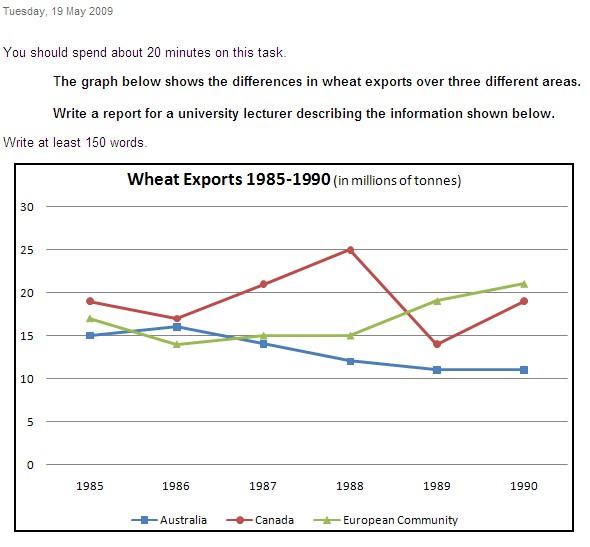
How much wheat had been exported in various regions is illustrated in the line chart. Overall, it can be inferred that the Canada market fluctuated significantly while Australia and Europe had a stable contrasting trend from 1985 to 1990.
In 1985, abroad countries bought wheat from Canada the most, but their export was nearly equalized by Australia who sold over 15 million of tonnes worldwide a year later. Similar to Canada, Europe also experienced a sharp decline of mostly 5 million before reaching 15 million which was kept stable until the next year. During 1987-1988, while there was a considerable growth in wheat export of Canada, reaching the peak of 25 million, Australia was reported to have gradually decreased their market. This trend had not stopped for Australia until 1990 when they could only sell about 10 million abroad. Meanwhile, Canada had experienced a dramatic plummet of more than 10 million before bouncing back and ending the year 1990 at nearly 20 million. Ultimately, in the last 2 years, Europe was the only area with a positive trend as it can be portrayed that their wheat export gradually had increased from 15 to over 20 million.
Thanks for reading my piece of writing. I would like you guys to have feedback on my structure and suggest improvements for vocabs. Also, if possible, could you give a general score on my wiritng.
Again, thanks in advance!

IELTSWritingTask1.jpg
