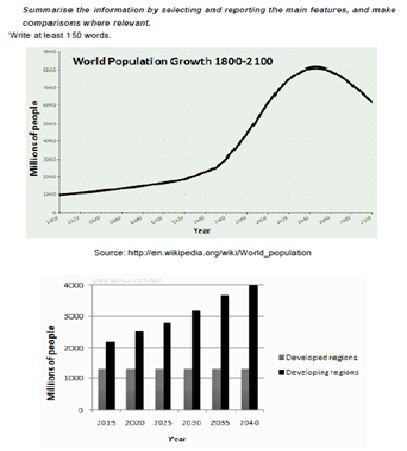
The line graph shows the particular people in the world between 1800 and 2100. And the bar chart compares the particular people of high-income countries with low-income countries over 25 years. The high-income countries have prediction steady trend until the end of the period of 2040 from 2015. However, the low-income country will increase significantly.
The particular of people in the world increased significantly from 1800 to 1960 which had 1000 millions of people in the first period to near 3000 millions of people in 1960. And in 1960 the population increased dramatically to under 6000 millions of people in 2000. Then, the prediction will get the peak number of people in 2040 for above 8000 millions of people. The last population will decrease to under 7000 millions of people in 2100.
The prediction also showed in the bar chart. The number of particular people in the developed country will always steady from 2015 to 2040 which had above 1000 millions of people in all of the years. However, the developing country predict will increase the population to 4000 millions of people from above 2000 millions of people between 2015 and 2040.

Line__Bar_Chart.jpg
