Please comment about my grammar entirely
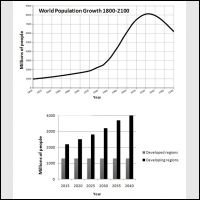
The graphs below provide information on global population figures and figures for urban populations in different world regions. Summarise the information by selecting and reporting the main features, and make comparisons where relevant.
Line chart below show the world nations growth between 1800 and 2100, whether the urban growth in different world region was figured by another bar chart consecutively.
Generally, the first graph illustrate whole of world population whom rose steadily from 1800 until middle period of report. While in the last half growth of citizen rose sharply before felt decreased onward.
More clearly, the number of inhabitants inception from 1,8 million and rose gradually approach2 millions in 1930. In 1940 this figure continued sharply and reaches a peak by 8 million people in 2040. The worldwide population onward abruptly fall a gradual from 8 to 6 millions in the last 30 years.
The second chart provides information about the differences of urban population in wealth and poor region in the range from 2015 to 2040. We can see according to the data, urban population drawing in wealth region had been stabled for all of years about 1,2 millions. In any case, city residents in developing region increased steadily average 5 millions in each 5 years measurement. This data, however, can be material for predict the urban growth in both of countries.
Overall, developing country has huge contribution to world rate population whom their inhabitants stepped up year by year.

global_population_fi.jpg
