Writing Task 1 (a report)
Write a report about education in Australia between 1997 and 2005.
_________________________________________________________________ ________________________________________
Answer:
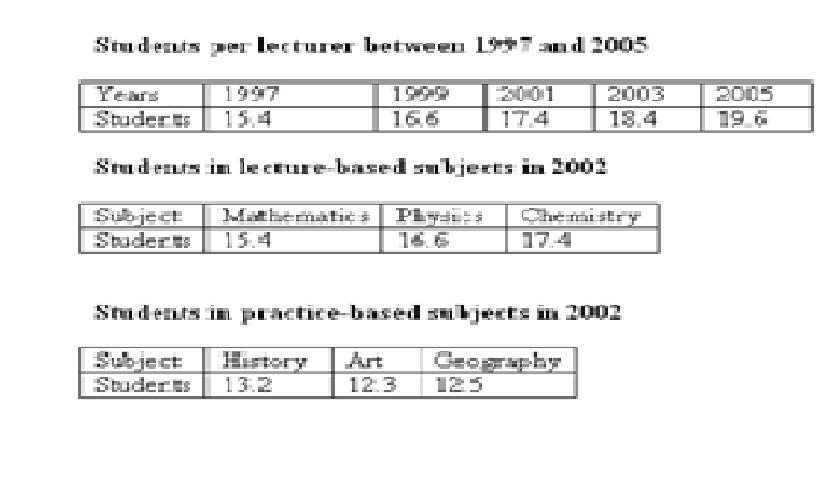
The tables show information about the students per lecturer and the number of students in practice based subjects and lecture based subjects.
Generally, There are providing statistical information about the proportion of students per lecturer during 1997-2005 and the participation of students in practice in 2002 and lecture based subjects in 2003.
In the first table, it is showed that in 1997, the students were continuing education in Australia approximately 15,4 students per lecture. It can be seen that overall, we witnessed increase slightly of students in 1999 approximately 16,6 students per lecture. Next, the greatest increase was observed between 2001, 2003 and 2005.
The last table, the participation of students in based subjects mathematics in 2002, followed by 15,4 students, physics liked by 16,6 students and chemistry had level higher than others what chosen by students. Next, participation of students in practice the most popular was history which was 13.2 student and the figures for art and geography were almost identical approximately 12 students per lecturer.
To sum up, the tables give information that subject of art is less popular than other subjects what liked by many students in Australia.

Table_education_Aust.png
