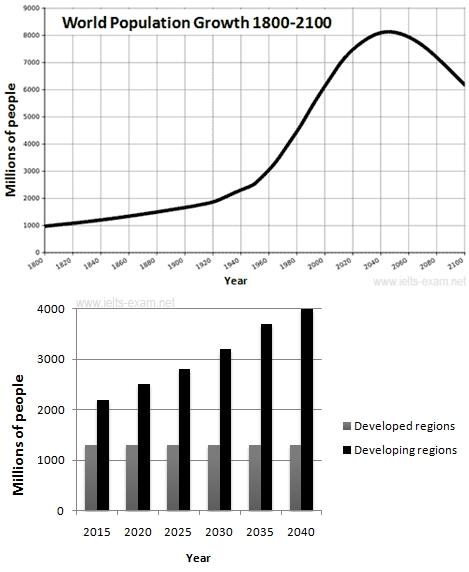
The line chart shows the information about the number of population growth between 1800 and 2100. While, the bar chart displays the number of population in developed countries and developing countries from 2015 to 2040. It can be seen that the highest inhabitation of developing countries will rise a peak dramatically in 2040. On the other hand, the developed countries stay constant from 2015 to 2040.
in 1800, the number of people in in the started at 1000 millions of people. The growth of population increased gradually to 3000 millions in 1950. And, it will increase sharply at 8000 millions in 2040. A rapidly decline will happen in the last of year in 2100. Despite, it will reach the same condition in the present.
Ultimately, by continuing a growing of population in developed country. It can be seen that the population of developed countries will occur a like of number around 1000 millions in 2040.

TUGAS_MALAM_INI.jpg
