Hi. I'm glad to have someone review my writing. Please give me some feedback and thank you!
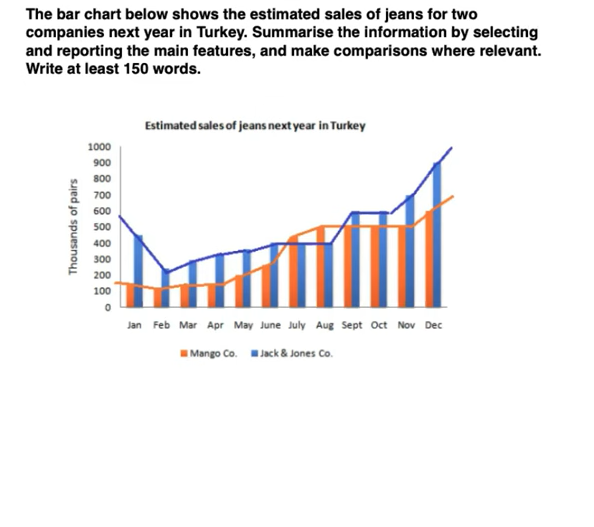
The graph depicts the predicted sales of jeans in Turkey of Mango Co and Jack & Jones Co company in the following year. Transactions are measured in thousands of jean pairs.
Generally speaking, there will be an upward trend in the sale of jeans. Furthermore, Turkish customers are predicted to buy more jeans from Jack & Jones Co than from Mango Co.
Regarding Mango Co, their sale amount in the first four months is predicted to start low around 100 thousand pairs. Following this, it will increase gradually until reach a plateau of 500 thousand jeans from August to November, and eventually, at the end of the period, peak at around 600 thousand pairs in December.
Switching to Jack & Jones Co, their sales numbers are predicted to be higher than that of Mango Co, with the only exception in two months July and August. Starting the period with a high amount of sales of more than 400 thousand pairs of jeans, Jack & Jones company then is expected to see a sharp decrease in their sales figures by 200 thousand jeans in February. After that, the forecasted sales will bounce back gradually at 400 thousand pairs in June and level off at this amount till August. Finally, the sale amount will increase considerably and reach a peak of about 900 thousand pairs at the end of the period.
sales of jeans graph
The graph depicts the predicted sales of jeans in Turkey of Mango Co and Jack & Jones Co company in the following year. Transactions are measured in thousands of jean pairs.
Generally speaking, there will be an upward trend in the sale of jeans. Furthermore, Turkish customers are predicted to buy more jeans from Jack & Jones Co than from Mango Co.
Regarding Mango Co, their sale amount in the first four months is predicted to start low around 100 thousand pairs. Following this, it will increase gradually until reach a plateau of 500 thousand jeans from August to November, and eventually, at the end of the period, peak at around 600 thousand pairs in December.
Switching to Jack & Jones Co, their sales numbers are predicted to be higher than that of Mango Co, with the only exception in two months July and August. Starting the period with a high amount of sales of more than 400 thousand pairs of jeans, Jack & Jones company then is expected to see a sharp decrease in their sales figures by 200 thousand jeans in February. After that, the forecasted sales will bounce back gradually at 400 thousand pairs in June and level off at this amount till August. Finally, the sale amount will increase considerably and reach a peak of about 900 thousand pairs at the end of the period.

111.png
