IELTS Writing task 1 Line Chart
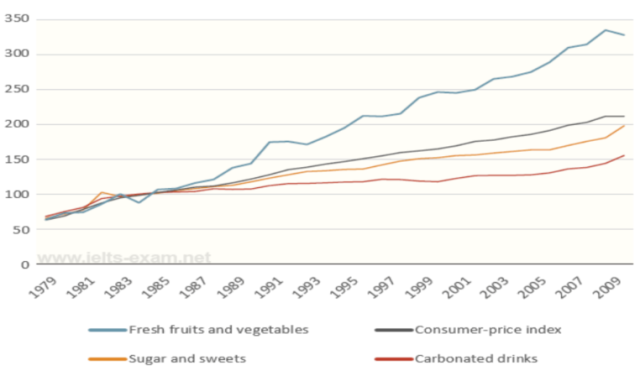
The line graph gives information about changes in price for three different food product groups over this 30-year period.
Overall, the price of three food product groups and CPI fluctuated from 1978 to 2009. Meanwhile, only the prices for fruits and vegetables varied more significantly than the increase in the general CPI.
It can be seen from the chart, all the lines have the same starting figure in 1979. Over the period, the consumer price index grew gradually from about 60 in 1979 to over 200 in 2009. There is no significant difference between sugar and sweets and carbonated drinks. In spite of the prices also increased, they were below the consumer price index after 1987. The figure for sugar and sweets was 200 in 2009, while the number of carbonated drinks at 150. After 1989, the prices for fruits and vegetables rose rapidly. From the same figure of about 60 in 1979, prices finished over 330 on the index in 2009.

task1_2.png
task1_2.png
