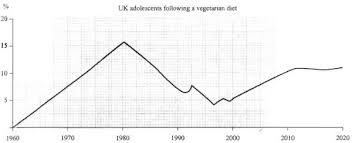
The line graph indicates the proportion of UK youths following a vegetarian diet in the period from 1960 to 2020. It is clear that the rate of young vegetarian fluctuated significantly and reached its peak in 1980.
In 20 years from 1960, there was a gradually upward trend in percentage of young people going on a vegetarian diet with the highest rate in 1960, at over 15%. Nevertheless, this figure went down steadily to 6% between the year 1991 and 1992. In addition, this trend increased slightly by 1% in 1998 after a substantial decline of the number of adolescent vegetarians.
Since the year 2000, as is shown by the chart that more and more young people going on vegetarian diet with the constant rise. And, in 2010, the rate of young vegetarians stood at about one tenth, which was still lower than this of in 1980 by 5%. It is also predicted that the trend of adolescents having a vegetarian diet will go up to the year 2020.
169 words

default.jpeg
