maihaan
Aug 21, 2020
Writing Feedback / IELTS Writing Task 1: Line chart comparing international conferences in 3 cities [5]
Please help me to make my essay better and free of mistakes. Thank you a lot for your support.
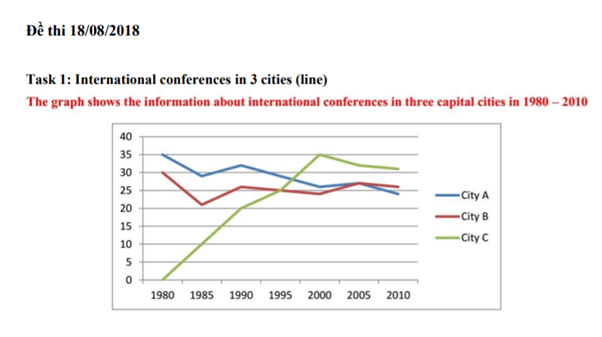
The line chart compares the number of international conferences hosted by three cities A, B, and C between 1980 and 2010. Overall, the quantity of international conferences in City A and B decreased while the number of City C, from the least in 1980, rocketed and ended up being the highest among all in 2010.
City A and City B experienced similar trends during the whole period of 30 years, with the former obtaining higher data most of the time. In 1980, the number of international conferences in cities A was 35, compared with 30 in city B. Both cities then witnessed narrowing fluctuations in the figures before holding the same number of 27 meetings in 2005. However, by 2010, meetings taking place in city B surpassed the number of city A, with 26 and 24 international conferences respectively.
In contrast, commencing at 0 in 1980, the quantity of global conferences that City C held surged to 20 after only 10 years and grew to 35 in 2000. Thenceforth, there was a slight decrease in the meeting number to 31 in 2010, yet city C still attained the first rank among the three cities.
Please help me to make my essay better and free of mistakes. Thank you a lot for your support.
international conferences hosted by three cities
The line chart compares the number of international conferences hosted by three cities A, B, and C between 1980 and 2010. Overall, the quantity of international conferences in City A and B decreased while the number of City C, from the least in 1980, rocketed and ended up being the highest among all in 2010.
City A and City B experienced similar trends during the whole period of 30 years, with the former obtaining higher data most of the time. In 1980, the number of international conferences in cities A was 35, compared with 30 in city B. Both cities then witnessed narrowing fluctuations in the figures before holding the same number of 27 meetings in 2005. However, by 2010, meetings taking place in city B surpassed the number of city A, with 26 and 24 international conferences respectively.
In contrast, commencing at 0 in 1980, the quantity of global conferences that City C held surged to 20 after only 10 years and grew to 35 in 2000. Thenceforth, there was a slight decrease in the meeting number to 31 in 2010, yet city C still attained the first rank among the three cities.

1.png


