yunana
Jul 7, 2016
Writing Feedback / IELTS Task 1 (Practice) Number of annual visits to Australia by overseas residents [4]
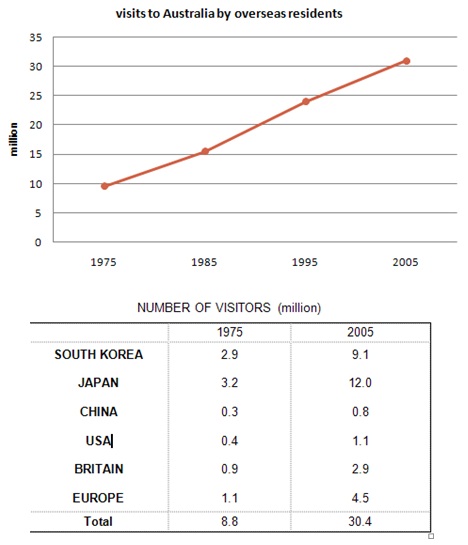
The line graph shows the number of overseas residents in Australia from 1975 to 2005, and the table compares six countries in terms of the number of visitors.
It is clear that the number of visitors rose gradually to about 10 million people in 1975 and 30 million people in 2005.
According to the table, in 1975, visitors of Japan were the most, while that of China were the lowest with 0.3 million people. The second lower country was USA with 0.4 million people. Visitors of other countries visit to Australia with 0.9~2.9 million people.
In 2005, visit to Australia by Japanese reaching with 12 million people, while visitors of China reached mere 0.8 million people. The second lower country was still USA with 1.1 million people. These figures were nearly fourth times as much as those of Europe. Overall, visitors of East countries were much more than those of west countries.
i66.tinypic.com/s4awpc.jpg

Graph