Unanswered [1] | Urgent [0]
  

Posts by intana28
Name: Intan pandora
Joined: Aug 11, 2016
Last Post: Aug 14, 2016
Threads: 4
Posts: 6  
From: Indonesia
School: sma38

Displayed posts: 10
sort: Oldest first   Latest first  | 
intana28   
Aug 13, 2016
Writing Feedback / The number of people with higher education level who planned to leave Bulgaria increased every year [2]

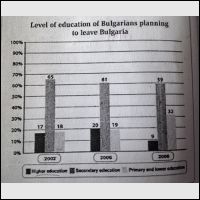
IELTS TASK 1 : Level of education of Bulgarians Planning to leave Bulgaria

The vertical bar chart describes the percentages of three different levels of Bulgaran people's education who wanted travel abroad in 2002,2006 and 2008. Overall, the percentage of people with higher education level who planned to leave Bulgaria was the highest in every year.

To begin, in 2002, there was a high percentage of Bulgarians people's with secondary education have planned to leave their country which was 65%. Meanwhile, ony 18% of Bugarian people from primary and lower education tought to go to other countries. Following by the figure of people with higher education was only 17%.

In 2006, the percentage of the level of Bulgarian people's education in secondary education fell slightly. However, the figures for higher education and primary and lower education rose which were 20% and 19%, respectively.

In the last period of time, there was about two times increase in the percentage of Bulgarian people's with primary and lower education. Meanwhile, the figure for higher education was approximately twice lower than in 2006.


  • q.jpg
intana28   
Aug 13, 2016
Writing Feedback / Task 1 - The percentage of housing owned and rented in the UK in 1985 and 2005 [2]

Hello molly,..

It is clear that while the number of housing (...) highest position in 2005. The proportion of rental of Council ...
... privately owned stood approximately at more than half ...
... in the total number and decreased sharply almost a doubled eventually.
intana28   
Aug 13, 2016
Writing Feedback / The most Bulgarian aged 15-60 planned to stay in their country with no intentions of emigration [3]

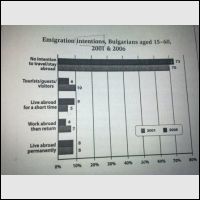
IELTS TASK 1; Emmigration intentions, Bulgarians aged 15-60, 2001 and 2006

The horizontal bar chart illustrates the percentage of five different plans of Bulgarian people age 15-60 concerning leaving their country in 2001 and 2006. The most striking feature is that most Bulgarian in age 15-60 planned to stay in their country in both years.

According to the graph, thr percentage of Bulgarian citizen who wanted to still leaving in their country decreased slightly from 73% in 2001 to 70% in 2006. Following that, there was a small fall in the figure of Bulgarian inhabitants who tought to travel abroad for a short time which was 9% in 2001 and 5% in 2006.

It is interestingly to note that the percentage of Bulgaria population who ived abroad permanently in 2001 and in 2006 was similar 8%). Meanwhile, the figure of Bulgarian people who wanted to visit to another country and the figure of Bulgarians who designed to work abroad then return in 2006 was greater than in 2001.

All in all, the graph suggests that in general, the percentage of Bulgarian people who had no intention to travel abroad accounted for just over seven times of the figure of other intentions of Bulgarian emigrant.


  • a.jpg
intana28   
Aug 13, 2016
Writing Feedback / Many people in urban society have unhealthy lifestyle while others always try to keep their body fit [2]

question :
Some people say that in the modern world it is very difficult for people to have a helathy lifestyle. Others however, say that it is easy for people to be heathy and fit if they want to be.

Introduction :

In the past decades have seen tremendous changes in people lifestyle. Many people in urban society have unhealthy lifestyle while others always try to keep their body fit and health. In my opinion, there are some reasons wh people think that to have a healthy lifestyle are hard while others enjoy their life in healthy way without big efforts.

Conclusion :
All in all, it is a big problem if people do not change their unhealthy lifestyle. By tried some easy steps of keep body active people do not spend much money to go to a gym.
intana28   
Aug 14, 2016
Writing Feedback / The privately owned houses overtook leading position in the British housing market. [2]

Hello adip...
your essay is good,..

there is a little correction from me,..

In 1985, privately owned showed the domination percentage than otherand stood at approximately 60% and the second which obtain the numerous proportion is council rated , accounting for 45%.

better if you breakdown your sentence into two sentences, so it can be clear and easy to follow.
intana28   
Aug 14, 2016
Writing Feedback / The most Bulgarian aged 15-60 planned to stay in their country with no intentions of emigration [3]

Hello ramzi, thank you for your comment.

The horizontal bar chart illustrates the percentage of Bulgarian people aged 15-60 who will leave their country based on five different reasons between 2001 and 2006. Generally speaking, most Bulgarian in age 15-60 planned to settle in the same period.

According to the graph, the percentage of Bulgarian citizen who wanted to still leaving in their country decreased slightly from 73% in 2001 to 70% in 2006. Following that, there was a slight fall in the figure of Bulgarian who tought to travel abroad temporary which was 9% in 2001 and 5% in 2006.

It is interesting to note that the percentage of Bulgarian who lived abroad permanently in 2001 and in 2006 was similar which was 8%. Meanwhile, the figure of Bulgarian people who wanted to visit to another country and the figure of Bulgarians who designed to work abroad then return in 2006 was greater than in 2001.

All in all,the percentage of Bulgarian who had no intention to travel abroad accounted for just over sevenfold from the oether plans.
intana28   
Aug 14, 2016
Writing Feedback / According to the graph, British people spent approximately 170.000 pounds on photographic film [3]

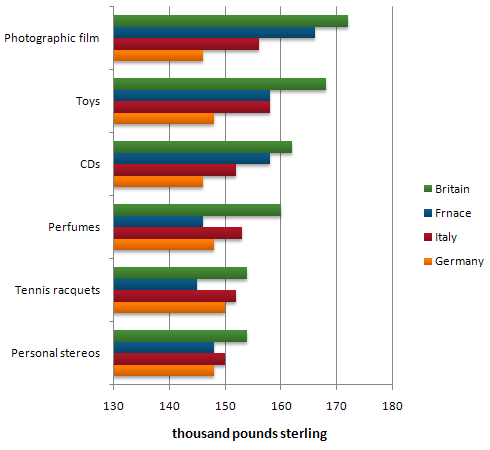
The horizontal bar chart describes how much money spent by four European countries on six different products. Overall, Britain spent significantly more money than three other countries on all six items. Moreover, consumers spent the most money on photographic film.

According to the graph, people in Britain spent approximately 170 thousand pound sterling on photographic film, which is the highest figure shown on the chart. In contrast, Germans were the lowest overall consumers, which spent just under 150 thousand pound sterling.

Interestingly, France and Italy have the same figures for spending on toys, at around 160 thousand poundsterling. Then, French people spent more money than Italians on photographic film and CDs. While Italians paid more money for personal stereos, tennis racquets and perfumes than French. The figure spent by French people on tennis racquets is the lowest figure shown on the chart, around 145 thousand pound sterling.


  • ieltswritingtask1.jpg
Need Writing or Editing Help?
Fill out one of these forms:

Graduate Writing / Editing:
GraduateWriter form ◳

Best Essay Service:
CustomPapers form ◳

Excellence in Editing:
Rose Editing ◳

AI-Paper Rewriting:
Robot Rewrite ◳

Academic AI Writer:
Custom AI Writer ◳