Unanswered [6] | Urgent [0]
  

Posts by Windvalley [Suspended]
Name: Trung ng
Joined: Aug 15, 2016
Last Post: Sep 23, 2016
Threads: 5
Posts: 5  
From: Viet Nam

Displayed posts: 10
sort: Oldest first   Latest first  | 
Windvalley   
Sep 14, 2016
Writing Feedback / Several holiday makers in New Zealand prefer to do such activities like walking, sightseeing, etc. [3]

Hi @almajid14, I see that you really have some problems with your writting here:
The bar chart illustrates the percentage (you missed the article)
... outdoor activities include/such as walking,...(like is informal )
The most activities which are always done => The most popular activity is walking, at 80%.
Next, there is a similar things which act in outdoor that is holiday which (...) then another activity that the people (...) have percentage which is too far from walking ( you used to many relative clauses in a sentence, which make the reader really hard to follow. I suggest reviewing this grammar structure)
Windvalley   
Sep 15, 2016
Writing Feedback / "Reasons for study" four out of five people under 26 take part in courses because of job opportunity [3]

IELTS writting task 1_"Reasons for study"

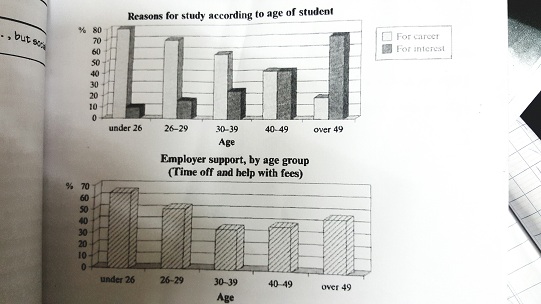
The first bar graph illustrates the percentage of students in different age groups, who study for career or interest, while the second one compares the support received from their employer.

What stands out from the charts is that a majority of young people study because of career. On the other hand, they also generally receive more support from their companies than middle age and elderly people

As can be seen, four out of five people under 26 take part in courses because of job opportunity, compared to only 10% for passion. Similarly, Almost 70% students between 26 and 29 admit they study for career rather than interest. As regards the age group of 30-39, twice as many as participants in the survey said their studying motivation mostly related to their career than preference.

An interesting point is that the proportion of student studying for career as many as that for interest, at 50%. If we look at the age group over 49, It follows a considerable different trend, with nearly a quarter of the respondents said they prefer studying because of hobby than work.

In terms of working hour and financial aid, top of the list were students under 26, with 60% have the supports from their employers. The age group of 26-29, over 49, and 40s come next, at 48%, 40%, and 32% respectively. Last on the list is people between 30 and 39, who do not receive as much as support from their employers than the others, at only 30%


  • 20160915_192153.jpg
Windvalley   
Sep 15, 2016
Writing Feedback / The least popular transportation chosen by the workers is cycling or walking [4]

... information about the percentage of travelers per form transport to work people who travel by each ...
-Meanwhile, (don't forget the comma here)the bar chart shows the amount of CO2 Emissions emitted from different formsmean/mode of transport
-EventuallyIn addition, there is connection between both ... (eventually= finally, only used in listing or describing multi-step process, we don't normally use these words in an overview. As your attached picture is to vague, I'm not sure about the purpose of this paragraph)

-The lastThe least popular transportation chosen ...
Windvalley   
Sep 15, 2016
Writing Feedback / Potential positions which are being inspected for the construction of a new supermarket in Garlsdon [2]

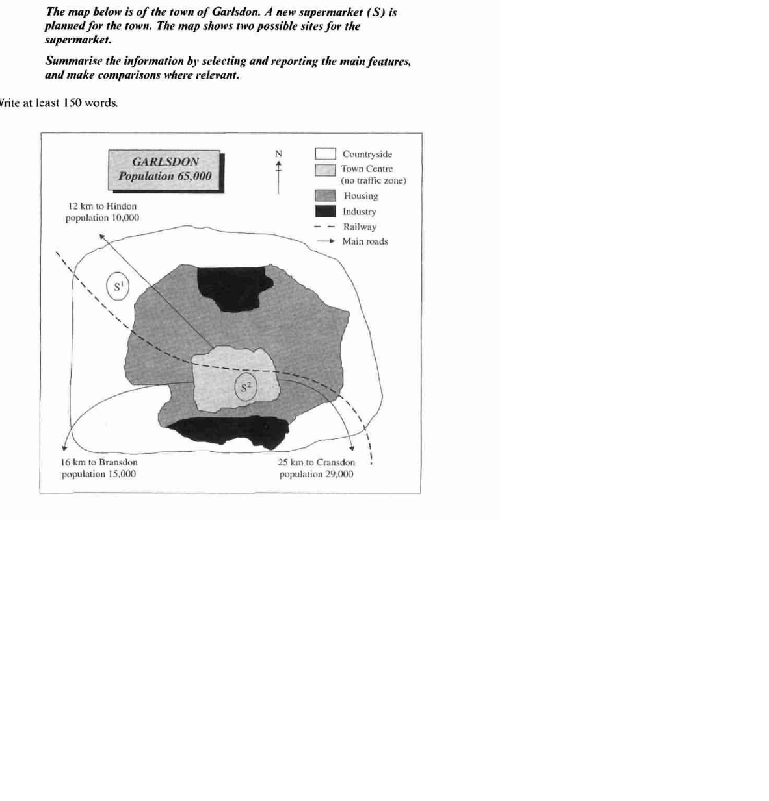
IELTS writting task 1_"sites for new supermarket"

The given map compares two potential positions which are being inspected for the construction of a new supermarket in Garlsdon.

In terms of position, the first site (S1) is located in the north-west countryside of the town, which is considerably far from the town centre. Meanwhile, the second site (S2) is surrounded by the town centre, housing and industrial parks, making it much more ideal to build a supermarket on. In adition, S2 is central from the three major satellite towns including Hindon 12 km north-west, Bransdon 16 km south-west, and Cranson 25 km south-east, adding around 54,000 people to the consuming market.

As regards the means of transport, S2 has three main roads, directly connecting it with Hindon, Bransdon, and Cransdon town. Having laid next to the railway, the site is accessible to the south-east sector. By contrast, the transport facilities of S1 is noticeably limited, with only one main road and railway, which connect it with the north-west of the town.

Overall, In comparison, S2 includes far more essential factors for the introduction of a supermarket than S1


  • Untitled.png
Windvalley   
Sep 16, 2016
Writing Feedback / "Comparison underground railway systems in 6 major cities." [2]

The data given in the table compares the underground railway systems in 6 major cities.

Overall, as can be seen, London, Paris and Tokyo are the three oldest and largest systems which serve many more commuters than the later ones including Whshington DC, Kyoto and Los Angeles.

Looking at the details, London, the oldest system was introduced in 1863. It is also the longest system with 394 km total length of railway, commuting 775m pedestrians per year. The second most popular system -Paris railway, opened from the beginning of 20th century, despite being only half as long as London, It serves almost doubly the quantity of passengers in London. Having operated from 1927, 27years later than Paris, Tokyo underground is used by 1927 commuters per year, making it the busiest system.

Regarding the group of later railway systems. Washington DC railway, serving 144m passengers every year, is longer than the others, with 126km. Although Kyoto underground has the shortest railway among 6 cities with only 11km, compared to 28km of Los Angeles wich is ranked in the fifth place, It serves nearly as many travelers as the larger one, at 45m and 50m respectively.
Windvalley   
Sep 16, 2016
Writing Feedback / The number of books read by the boys and girls - a fluctuating trend between the two variables [2]

-The line graph gives information about the comparison number of books (...) and girls over a four-year period at ...
There arewas a fluctuating trend ...
-... books read by the boys was steadily increased.
- It achieves achieved thea peak at in 2011 with over a hundred books have been read ( However, I don't see present perfect tense appropriate here)

-Unfortunately, it was experienced a sharply decreasing trend downward trend to the until 2012...
- Meanwhile, reverse Conversely, to the boys... ("reverse" means go back to the previous state, or turn back the process)
-It follows Following this, that the gap between the boys...
Windvalley   
Sep 16, 2016
Writing Feedback / The contribution of 6 major energy resources in the US over a 50 years period [2]

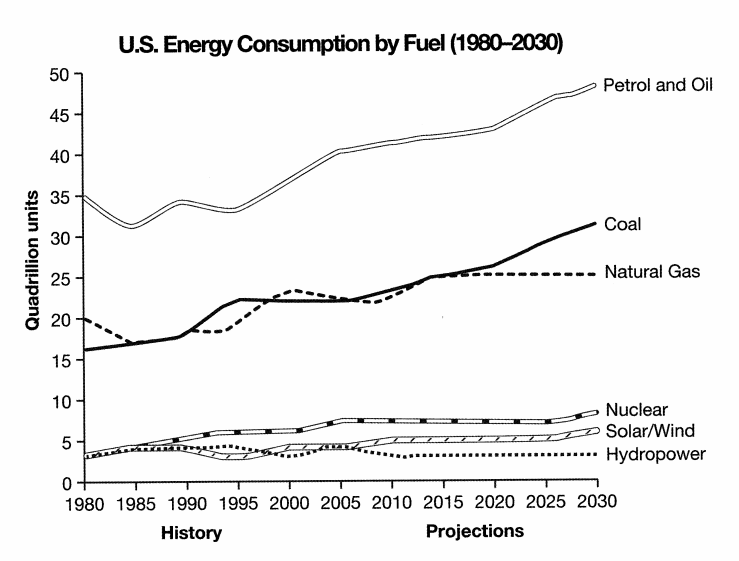
The line chart illustrates the contribution of 6 major energy resources in the US over a 50 years period, including the anticipation until 2030.

Overall, as can be seen, There was considerable upward trends in the group of fossil energy; meanwhile, friendly environmental resources witnessed a slight increase or remained stable during the period covered by the graph. These trends will keep going until 2050 of the given period. Another noticeable point is that Petrol and Oil are predicted to will have been being the most popular energy resource in the future.

As regards, the fossil energy resources, Coal and Natural Gas followed the similar patterns. Rising significantly to around 25 in 2015, Coal energy will then soar to 30 in 2030, while Natural gas will level off till the end of the period. If we look at Petrol and oil, despite fluctuating around 35 through the first decade, It then grew dramatically to approximate 43, before surging to just lower 50 in 2030, this is also the peak level figure during the whole period.

By contrast, Hydropower experienced a marginal variation around 3 until 2015, and then will remain stable over the rest of the period, making it the lowest supplier among 6 categories. Slightly more promising, but Nuclear and Solar/Wind were anticipated will hardly exceed 10.


  • us_energy.png
Windvalley   
Sep 17, 2016
Writing Feedback / The private car is the most popular vehicle in Edmonton used for commuting to work, business, etc. [2]

Ielts writing taks 1_Edmonton car use

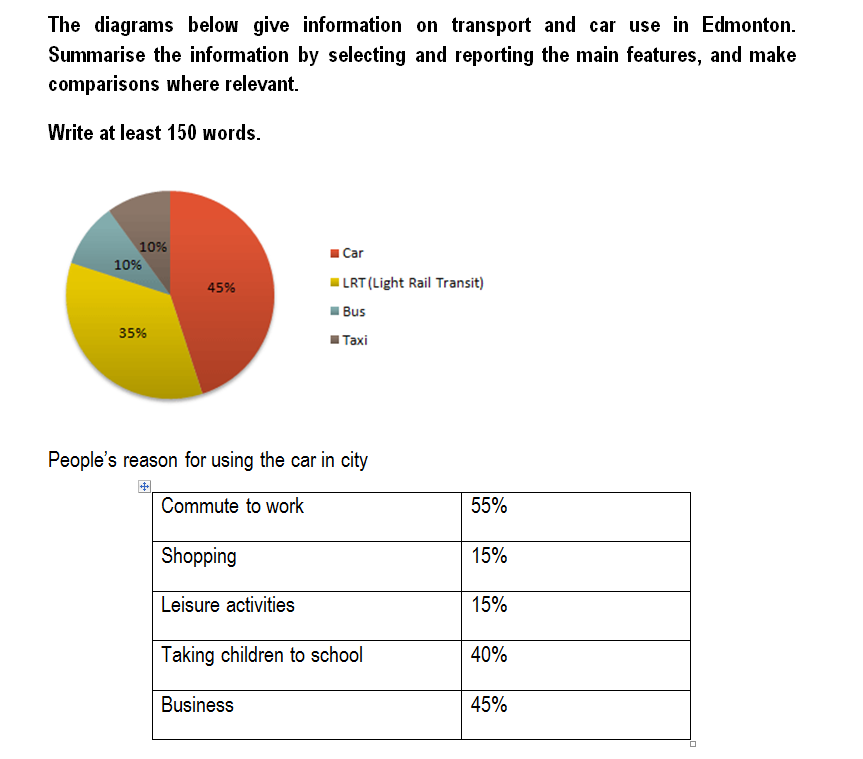
The pie graph compares the popularity between 4 major means of transport in Edmonton, while the data given in the table illustrate the reasons why the city residents use automobiles.

Overall, what stands out from the graph is that private car is the most popular vehicle which is used mainly for travelling to work, business, and taking children to school.

As can be seen, top op the list is private car, which represents for nearly half of transport in Edmonton. LRT comes next with over a third of the city population using it. Bus and taxi are the least popular mode of transport, at 10% for each one.

Looking at the details, A majority of car owners said they use it for transport between home and workplace, as well as business purposes, at 55% and 45% respectively. Another large percentage of parents taking the kids to school by car, at 40%. Shopping accounts for 15%, and leisure activities, at the same rate, are the two lowest recorded figures


  • Edmonton_car_use.png
Need Writing or Editing Help?
Fill out one of these forms:

Graduate Writing / Editing:
GraduateWriter form ◳

Best Essay Service:
CustomPapers form ◳

Excellence in Editing:
Rose Editing ◳

AI-Paper Rewriting:
Robot Rewrite ◳

Academic AI Writer:
Custom AI Writer ◳