hanasufiarahma
Dec 30, 2016
Writing Feedback / Comparison of the society growth and urban areas [2]
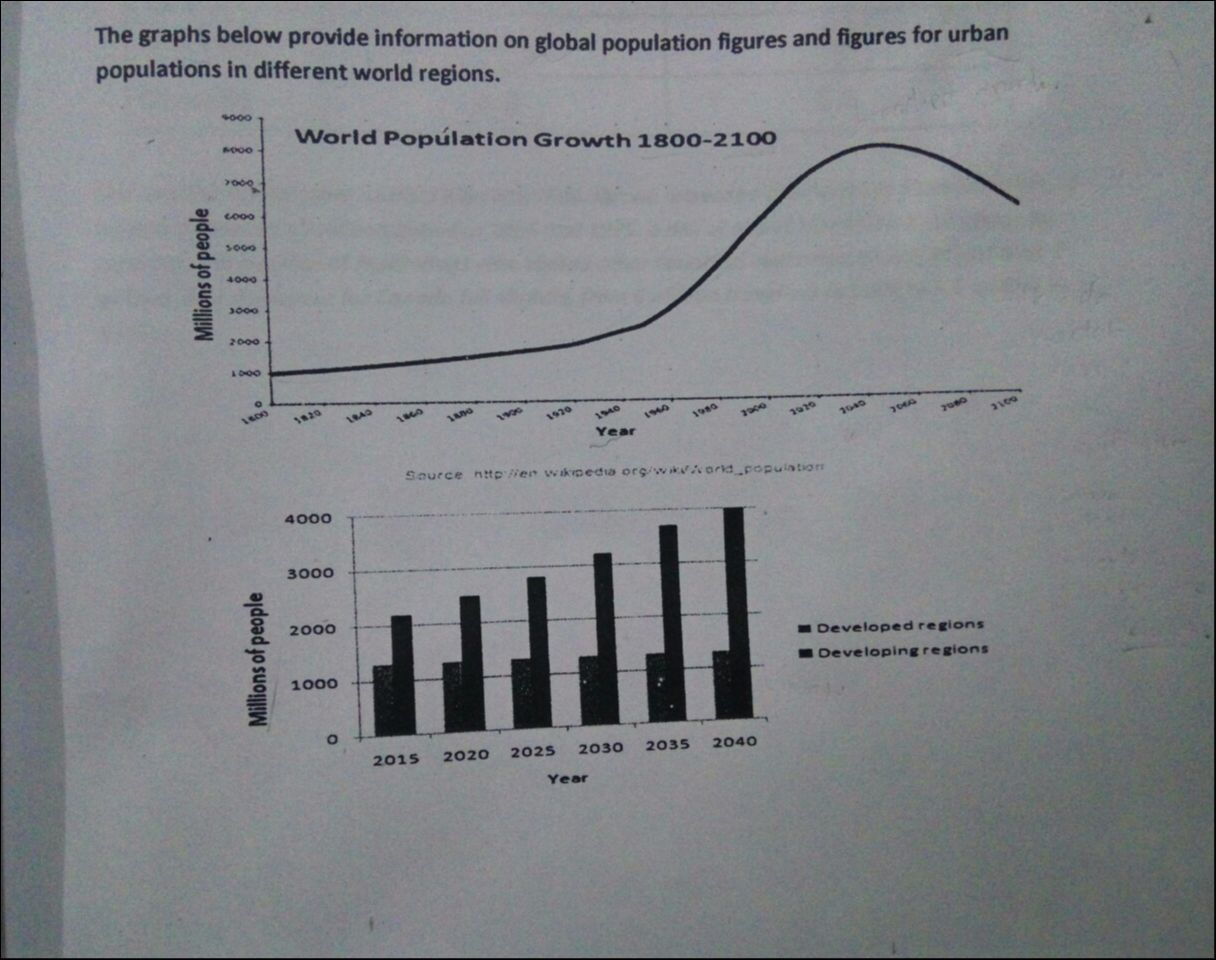
The line graph illustrates society growth from 1800 to 2100, and the bar charts measure the population of urban in developed and developing areas. Overall, the highest world society on global and developing regions in 2040. However, the developed regions more or less stable.
In 1800, the number of society stood at 1000 millions of people and increased gradually until 1960. Moreover, it had inclined dramatically to 8000 millions of people in 2040. Then, the graph experienced decreased in the following six decades from approximately 8000 to 6500.
On the other hand, figure of the developing regions populations started at more or less 2300 millions of people and steadily inclined until 2040 with an increase less than 500 millions of people per years.
Despite, Developing areas and Global population have the same peak in 2040, their are different of the number of started point and at the end of the period. Furthermore, the developed countries had the same number at approximetely 1200 between 2015 and 2040.

IMG_20161231_003425_.jpg


