Unanswered [0] | Urgent [0]
  

Posts by Sherk
Name: Quoc Thinh
Joined: Dec 16, 2018
Last Post: Jan 17, 2019
Threads: 4
Posts: 7  
Likes: 2
From: Viet Nam

Displayed posts: 11
sort: Latest first   Oldest first  | 
Sherk   
Jan 17, 2019
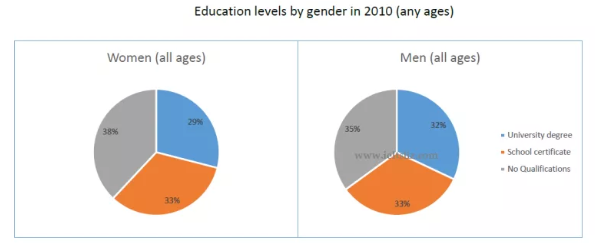
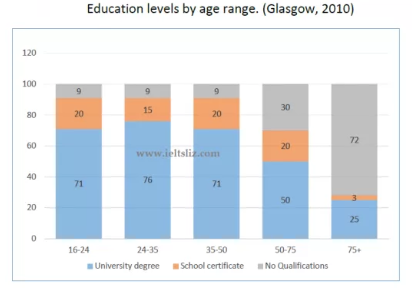
Writing Feedback / The chart below give information about levels of education in Glasgow, a city in Scotland, in 2010. [2]

education levels by genders and age range


The bar chart and pie chart illustrates the percentage of education levels by genders and age range in Glasgow, a city in Scotland, in 2010. The information is provided surrounding three different education levels are University Degree, School Certificate and No Qualification.

Overall, the age groups embrace an aggregate of University Degree's education level in the bar chart was primarily colossal of five age items. Furthermore, University Degree has a massive number of majority proportion from 21 to 35 age range (76%). In addition, there is a subtle difference between Scholl Certificate and No Qualification at over 75 age. Slightly more people who were without certificated than men and women have a diploma in school( 72% and 3% respectively).

In terms of School Certificate, out of the five age ranges, in each proportion from 16 to 75 age ranges which have slightly fluctuated 15% and 20% respectively. Moreover, it has corresponded percentage of both genders (33%). Compared to, No Qualification's aged 16 to 50 was one and the same percentage is 9%.

Regarding the pie chart, No Qualification has the highest percentage of educational certification that any genders were achieving with all age.


Sherk   
Jan 17, 2019
Writing Feedback / Ielts Writing Task 1 line graph: Crude oil prices US dollars per barrel [2]

1. You should write the overall's information in your essay.

2. the next 14 4 years

3. very cheaply but before Arab oil

4 years before rocketing to

> You should use more grammar structures.

4. From 1998, the figure rose ...
> What were you trying to say here?

> [...] reached the highest peak of 50 dollars one barrel during the event happened.
> You should indicate the highest point of the figure in the essay text.
Sherk   
Jan 6, 2019
Writing Feedback / Products price fluctuation - fresh fruits and vegetables, sugars and sweets, and carbonated drinks [5]

> Overall, it is clear that the prices .... Only Whereas, the price for of fresh fruits ...

> Should not be using the order like firstly, secondly, finally, etc in the IELTS's essay.
> Finally In addition, ... lower than the figure for sugar and ...
> Try to write shortly and clearly as you can. Avoid written redundantly words.

> You did not know exactly what the numbers in this essay are, so you should not be more clear of the number. Using words such as around, negligible, merely, etc.

P/s:
1. You should use more coherence and cohesion, this is the link you can check (~doregan/Writing/Cohesion.html).
2. You should be compared to three food product groups and written 'Consumer-price index' in the other paragraph.
3. You have to compare where the relevant is.
Sherk   
Jan 6, 2019
Writing Feedback / The given figure shows the birth rates during the period from 1920 to 2000 in China and the USA. [2]

birth rates in china and usa


The figure is given shows the birth rates during the period from 1920 to 2000 of China and the USA.

Overall, the fertility of the USA was highest in 1950 reaching a peak of 15 per cent compared to the rate peak at the same rate in China in 1935. In addition, both nations saw considerable fluctuation that also has sharply decreased since 1960.

The birth rates of China was dramatically decreased from 1935 to 1940 (15% and 5% respectively) compared to from 1940 to 1945 in the USA was plunged to low of just 5 per cent. On the other hands, China's birth rate was not changed at 5 per cent. Both in the USA and China was followed by a period of exponential growth in 1950 (20% and 15% respectively).

In contrast, since 1950, China fell abruptly the next five years to under 10 rates, whereas, in the USA was sharply decreased to under 15 rates.
A glance at the graph provided reveals some striking similarities from 1960 to 2000. Furthermore, the birth rates of both countries have fluctuated between 5 and 10 respectively since 1970. The fertility's lowest in China was becoming less than behalf of 5 per cent in 1980 and 2000. (206 words)

Helps me what I am wrong in this essay, thanks for your comments, that helps me to improve a lot. Sincerely.


Sherk   
Jan 6, 2019
Writing Feedback / What is it that excites me the most about a college. [4]

Unfortunately, still millions of ...

I want to be become an engineer who can could connect to the people, engaged in their community ...
... what I am require required to for fulfill fulfil my dream.

... research the opportunities and ... I look forward to presenting my ...
Sherk   
Jan 6, 2019
Writing Feedback / IELTS II : Is it right to exclude males or females from certain professions because of their gender? [4]

1. You're absolutely not writing an exactly the topic sentences in your essay, you have to substitute your idea, words.

2. You show your too much examples but not reveals what the core of the correct to exclude the profession of gender is.

3. You should write a conclusion after a single paragraph, an example to impress, why you include these are.

4. You're repeated many times:
+ [...]someone's success is not based on the genders. If people give the big effort to get something[...]
+ [...]It is totally wrong because in today's world all of the genders have the same opportunities, and no do successful people depend on the sex, but it depends on the people's hard work.[...]

> Should not: 'It is' is the opening sentences.
> 'no do successful people depend on the sex' compared to 'but it depends on the people's hard work' is not suitable and is NOT of the MAIN HEADING of the topic.

> The success of someone is should not the key in your essay, you relapse its too much.

5. Do not just write the 'opposite' sentences, you have to 'spread' what you're trying to mention.
Sherk   
Dec 27, 2018
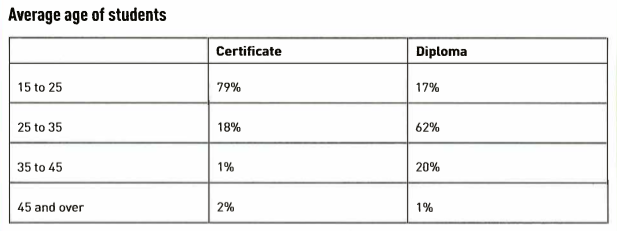
Writing Feedback / [Task 1] The following tables show the average age of students at a college. [3]

correlation of certificate and diploma with student's age


A glance at the table provided reveals a number of the average age of students at a college is different between the certificate and diploma.

Out of the five ages, the highest percentage on certificate and diploma belongs to the student's age from 15 to 25 and from 25 to 35 respectively. Furthermore, the age of both proportions have the lowest percentage is 45 and over.

Regarding in the table, the percentage of students have aged from 15 to 25 with certificate education is scrutiny higher than other on the same proportion compared to the diploma, simultaneously, diploma education has highest from 25 to 35 than others its level( 79% and 62% respectively). Both the certificate and diploma have fluctuated between 17% and 18%.

In terms of the certificate, the percentage of student's age from 35 to 45 is 1% on this as opposed to exactly 2% at 45 and over. On the other hand, the diploma has massive rate fluctuation between 35 to 45 and more than 45 age group of students at a college(20% and 1% respectively). (179 words)

I really appreciate with all your help!
Please, I would love to if you dedicate to show me what my mistakes about the idea, grammar, linking words are.
Best regards.


Sherk   
Dec 16, 2018
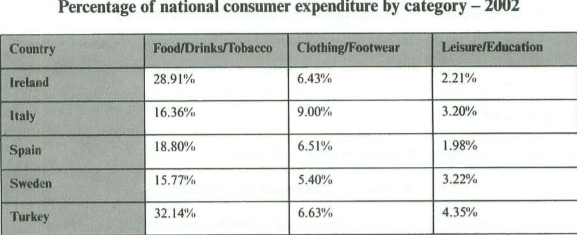
Writing Feedback / The table reveals the threefold of national consumer expenditure category [2]

CONSUMER SPENDING IN SOME EUROPEAN COUNTRIES


The table below gives info on consumer spending on different items in five different countries in 2002
Summarise the information by selecting and reporting the main features, and make comparisons where relevant.


The table reveals the threefold of national consumer expenditure category that was spending to the different countries(Ireland, Italy, Spain, Sweden, Turkey) in 2002. Regarding the table, the value of food, drunk, and tobacco made up an overwhelming majority of the category.

Overall, the leisure and education's value was lowest and did not exceed 5,00%. Spain with the lowest percentage is 1,98%. Turkey is the country with the highest percentage in this field is 4,35%. In terms of the source of the table information, Italy was predominantly expenditure (9,00%) in clothing and footwear as opposed to other countries, meanwhile, which have not fluctuated over 1%.

It is evident from the information provided that Turkey and Ireland had far the high number of food, drunk, and tobacco as the preponderant supplier and made up 32,14% and 28,91% respectively.

Please, I am a newbie, someone helps me where I am wrong about the idea, grammar, etc.
Thank you so much,
Have a nice day!
Sincerely.


Writing
Editing Help?
Fill in one of the forms below to get professional help with your assignments:

Graduate Writing / Editing:
GraduateWriter form ◳

Best Essay Service:
CustomPapers form ◳

Excellence in Editing:
Rose Editing ◳

AI-Paper Rewriting:
Robot Rewrite ◳