Writing Feedback /
The table illustrates data about changes in types of travel in Britain over a 15-year period [3]
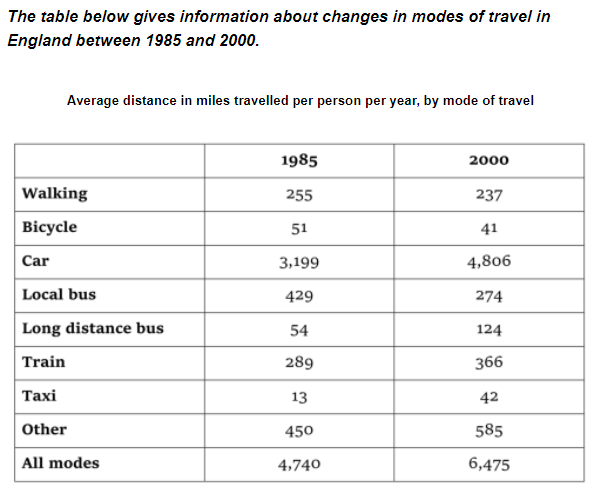
changes in modes of travel in England between 1985 and 2000
The table illustrates data about changes in types of travel in Britain over a 15-year period.
Roughly speaking, there was a significant increase in average travelling distance for British people from 1985 to 2000. In addition, travelling by car remained the most popular transport tool in both years.
It is clear from the table that among the 8 categories of transport method, car accounted for the longest distance in miles traveled per person per year, reaching as high as 3,199 miles and 4,806 miles in the year 1985 and year 2000 respectively. By contrast, Taxi and bicycle remained the least popular option for people in England over the same period, which represented 13 miles and 51 miles in 1985, and 42 miles and 41 miles in 2000 respectively.
It is particularly noticeable that of all types of transport, only three of them, including walking, bicycle and local bus, showed a downward trend in usage. However, looking from an overall point of view, the average distance traveled by British people experienced a rise from 4,740 miles to 6,475 miles.

1.PNG


