jackjixam13
Sep 10, 2020
Writing Feedback / The line graph displays how much acid rain was emitted by four different sectors in the UK [2]
Hi guys,
I'm practicing IELTS writing task 1. Please give me some comments on my essay. Thanks in advance!
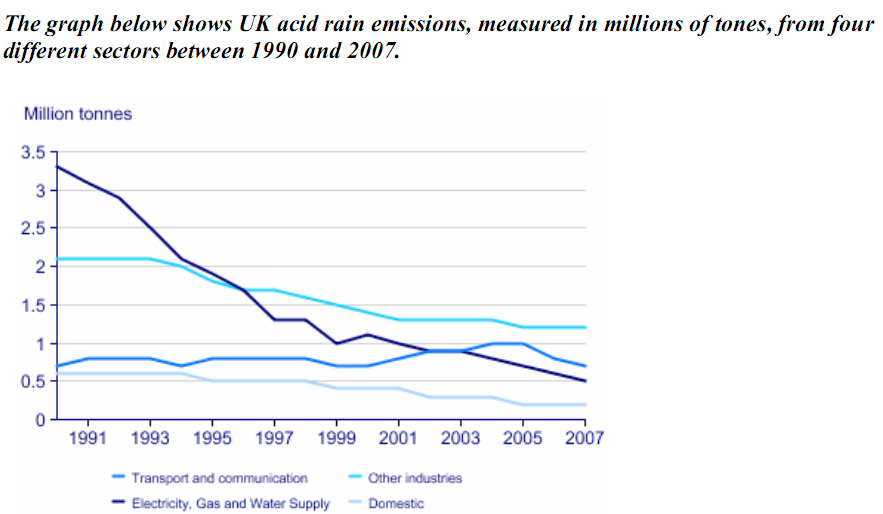
The line graph displays how much acid rain was emitted by four different sectors in the UK over 27 years from 1990.
Overall, what stands out from the graph is that acid rain emissions reduced dramatically during the period shown. In addition, the amount of acid rain caused by electricity, gas and water supply witnessed the most tremendous decrease, from the primary culprit to the second least polluted sector.
In 1990, around 3.25 million tonnes of acid rain was caused by electricity, gas and water supply, which was by far higher than the equivalent figure for other industries, with just over 2 million tonnes. However, in the next 27 years, there was a significant decline of 2.75 million tonnes in the amount of acid rain generated by electricity, gas and water supply. Meanwhile, the figure for other industries, despite falling, overtook electricity, gas and water supply to become the most contaminated sector, at around 1.75 million tonnes 1997 and 1.25 million tonnes in 2007.
There was an insignificant amount of acid rain which was produced by transport, communication and domestic. In 1990, each sector caused nearly 0.75 million tonnes of acid rain. Subsequently, the figure for transport and communication fluctuated slightly between 0.75 and 1 million tonnes over the rest of the period. As for the amount of acid rain produced domestically, it fell steadily to about 0.25 million tonnes in 2007.
Hi guys,
I'm practicing IELTS writing task 1. Please give me some comments on my essay. Thanks in advance!
IELTS Writing task 1: Acid rain
The line graph displays how much acid rain was emitted by four different sectors in the UK over 27 years from 1990.
Overall, what stands out from the graph is that acid rain emissions reduced dramatically during the period shown. In addition, the amount of acid rain caused by electricity, gas and water supply witnessed the most tremendous decrease, from the primary culprit to the second least polluted sector.
In 1990, around 3.25 million tonnes of acid rain was caused by electricity, gas and water supply, which was by far higher than the equivalent figure for other industries, with just over 2 million tonnes. However, in the next 27 years, there was a significant decline of 2.75 million tonnes in the amount of acid rain generated by electricity, gas and water supply. Meanwhile, the figure for other industries, despite falling, overtook electricity, gas and water supply to become the most contaminated sector, at around 1.75 million tonnes 1997 and 1.25 million tonnes in 2007.
There was an insignificant amount of acid rain which was produced by transport, communication and domestic. In 1990, each sector caused nearly 0.75 million tonnes of acid rain. Subsequently, the figure for transport and communication fluctuated slightly between 0.75 and 1 million tonnes over the rest of the period. As for the amount of acid rain produced domestically, it fell steadily to about 0.25 million tonnes in 2007.

acidrain.png