Pore
Aug 18, 2022
Writing Feedback / IELTS 1 Line graph - The proportion of possessing various tools powered by electricity / chores time [2]
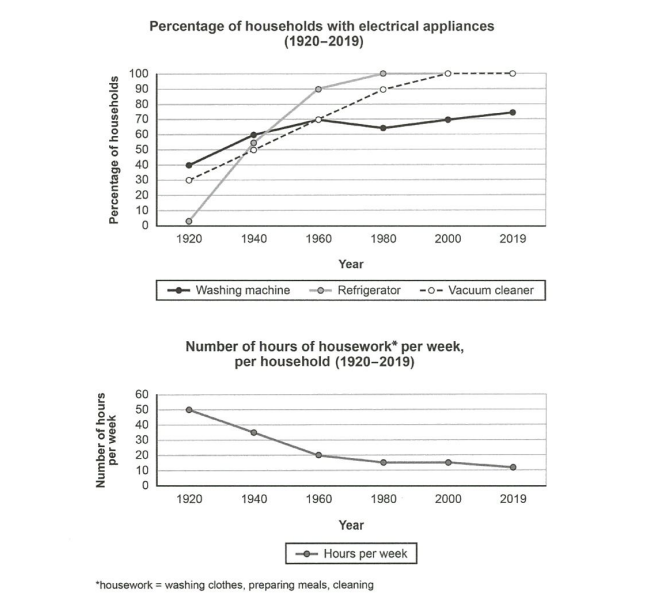
The charts below show the changes in ownership of electrical appliances and ammount of time spent doing housework in households in one country between 1920 and 2019.
The line graphs demonstrate not only the proportion of possessing various tools powered by electricity but also how long it took people in a nation to do chores throughout a century long duration from 1920. Overall, it is depicted in the first picture all three figures grew, and most equipments had been fulfilled in houses other than the laundry device. Meanwhile, via the second one, a downward trend could be witnessed in the amount of housework time.
In terms of electical appliances, washing machines were previously the most popular equipment among all and doubled their statistic in the end, but they were outnumbered by the other two in 2019. This increment was too minimal compared with those of the vacuum washer and the fridge which both had rocketed and reached 100% in 1980 and 20 years later, respectively. Noticeably, this had yet been obtained by the laundry property.
Glancing at the second chart, it is highlighted that surveyees had been taking a smaller part in accomplishing chores. Their number of working hours spent a week had plummeted by more than half from 50 hours until 1960 when the changes were not as significantly as before, and the data was kept quite stable between 10 and 20 for the next 5 decades. (209)
I am wondering if my grammar structure is comprehensive enough because sometimes I feel I overwrite sentences. I will also be very grateful for your feedback!
The charts below show the changes in ownership of electrical appliances and ammount of time spent doing housework in households in one country between 1920 and 2019.
Summarize the information by selecting and reporting the main features, and make comparisons where relevant.
The line graphs demonstrate not only the proportion of possessing various tools powered by electricity but also how long it took people in a nation to do chores throughout a century long duration from 1920. Overall, it is depicted in the first picture all three figures grew, and most equipments had been fulfilled in houses other than the laundry device. Meanwhile, via the second one, a downward trend could be witnessed in the amount of housework time.
In terms of electical appliances, washing machines were previously the most popular equipment among all and doubled their statistic in the end, but they were outnumbered by the other two in 2019. This increment was too minimal compared with those of the vacuum washer and the fridge which both had rocketed and reached 100% in 1980 and 20 years later, respectively. Noticeably, this had yet been obtained by the laundry property.
Glancing at the second chart, it is highlighted that surveyees had been taking a smaller part in accomplishing chores. Their number of working hours spent a week had plummeted by more than half from 50 hours until 1960 when the changes were not as significantly as before, and the data was kept quite stable between 10 and 20 for the next 5 decades. (209)
I am wondering if my grammar structure is comprehensive enough because sometimes I feel I overwrite sentences. I will also be very grateful for your feedback!

ielts.PNG

